Drawing an organization chart
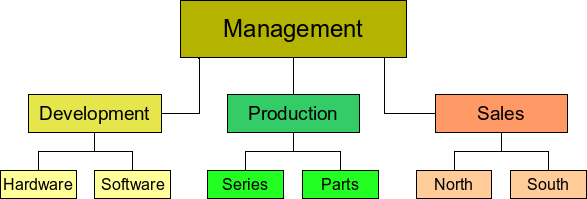
Draw offers no special toolbar for creating organization charts, where individual fields appear as rectangles. Drawing these charts presents no special problems, however (see Figure 1). The use of different fill colors clearly represents organizational linkages and by drawing rectangles with different heights you can see the various hierarchies. With a color progression from dark tones to bright, this effect can be reinforced. Watch that the color choices maintain a good contrast between text color and background so that you can easily read the printed diagram.

Figure 1: Example of an Organization Chart.
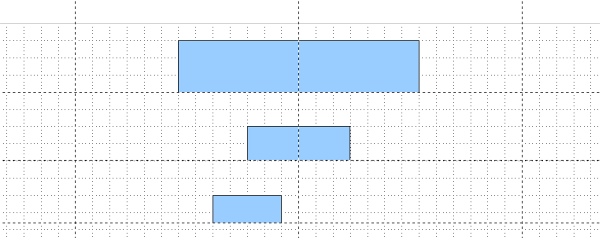
At the beginning it is useful to prepare a setup page or draft, with snap lines, to assist in drawing the various hierarchies and responsibility paths and typical boxes that you will use in drawing the chart.

Figure 2: Draft with snap lines.
Individual boxes are placed and dimensioned according to ‘feel’. The exact size (particularly width), position, and color will be fixed later. It is sometimes easier to draw only one box per level, to duplicate this box and then move it to the desired position. In Chapter 4 you will find useful the commands for making mirror copies, and the section on styles could also be helpful. One can also select an object and use the menu command Edit > Duplicate in order to make copies of one or more boxes (see Figure 3). The spacing of the duplicated object(s) to the original can be input in the placement fields for X and Y axes – note that positive values for X and Y are (relative the original object) to the right and downwards respectively.

Figure 3: Duplicating an object.
Which replication technique you choose to use is up to you. The draft for the example in this chapter should look similar to that in Figure 4.
In the next step you can see how to add text to individual boxes. As described in Chapter 2 (Drawing basic shapes) the text is best input as an element in the box. Activate the button [[Image:]] on the Options toolbar and then double-click the box to enter text into it. Alternatively select the box and press F2. You should then see a blinking cursor in the box and the Text Formatting toolbar should be visible.
If the text formatting is as you want it, you can input text. Depending on the length and formatting of the text it may be necessary to adjust the size of the box and the spacing to neighboring boxes. Adjustments can be made initially with the mouse and then “fine tuning” is possible with the Position and Size window.
Now you can set up the fill colors and store the drawing. The connections between the boxes are not drawn with ordinary lines but with the Connectors which Draw uses. How you draw these connectors and add text to them is described in detail later in this chapter.
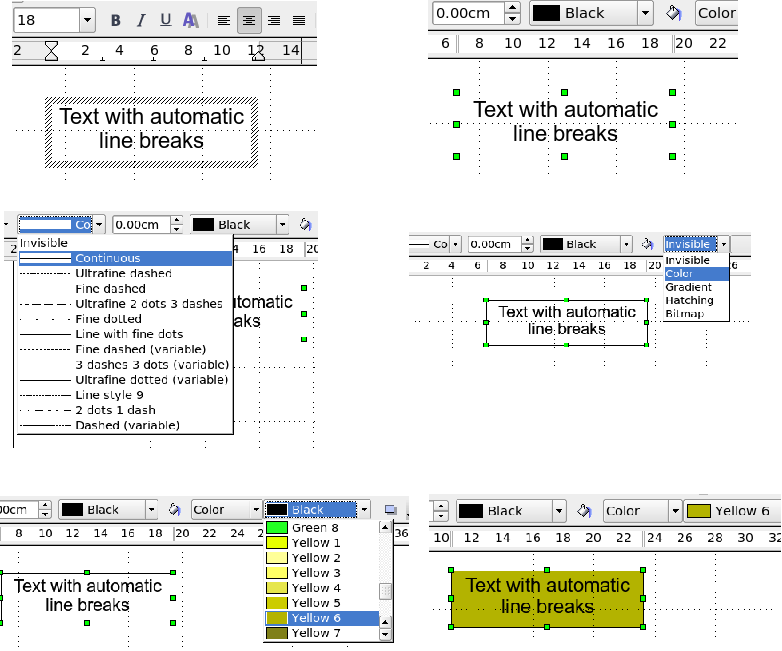
You can also use text frames for the boxes. These have the advantage of automatic line breaks. Figure 5 shows the individual editing steps of text input, adding lines and setting the background color for a text frame.

Figure 5: Working with text boxes.
| Content on this page is licensed under the Creative Common Attribution 3.0 license (CC-BY). |
