Difference between revisions of "Documentation/OOo3 User Guides/Calc Guide/DataPilot example 3"
(New page: {{DISPLAYTITLE:DataPilot example 3: Frequency distribution}} {{Documentation/CG3Ch6TOC |ShowPrevNext=block |PrevPage=Documentation/OOo3_User_Guides/Calc Guide/DataPilot example 2 |NextPage...) |
|||
| (6 intermediate revisions by 2 users not shown) | |||
| Line 5: | Line 5: | ||
|NextPage=Documentation/OOo3_User_Guides/Calc Guide/DataPilot functions | |NextPage=Documentation/OOo3_User_Guides/Calc Guide/DataPilot functions | ||
}}__notoc__ | }}__notoc__ | ||
| − | For showing the frequency of incidents, Calc uses the function FREQUENCY. This formula has to be used in a so-called matrix formula. This is an advanced feature. | + | For showing the frequency of incidents, Calc uses the function FREQUENCY. This formula has to be used in a so-called matrix formula. This is an advanced feature. Alternatively you can use the DataPilot, which requires almost no knowledge of spreadsheets. |
In our example we want to investigate the number of emails that go to the Germanophone support mailing list ([mailto:users@de.openoffice.org users@de.openoffice.org]). We want to know how the activity on the list is distributed during the day. | In our example we want to investigate the number of emails that go to the Germanophone support mailing list ([mailto:users@de.openoffice.org users@de.openoffice.org]). We want to know how the activity on the list is distributed during the day. | ||
| − | The starting point for this example is the mailbox file of the Thunderbird mail client. The command grep 'Delivery-Date:' Inbox creates a text file that contains for the timespan of more than 2 years one line for each message, with date and time. | + | The starting point for this example is the mailbox file of the Thunderbird mail client. The command |
| + | |||
| + | <tt>grep 'Delivery-Date:' Inbox</tt> | ||
| + | |||
| + | creates a text file that contains for the timespan of more than 2 years one line for each message, with date and time. | ||
[[Image:CG3Ch6F20.png|thumb|none|500px|''Raw data for the frequency of the messages'']] | [[Image:CG3Ch6F20.png|thumb|none|500px|''Raw data for the frequency of the messages'']] | ||
| Line 25: | Line 29: | ||
[[Image:CG3Ch6F21.png|thumb|none|500px|''Import settings'']] | [[Image:CG3Ch6F21.png|thumb|none|500px|''Import settings'']] | ||
| − | The figure below shows the imported raw data with a line added at the top | + | The figure below shows the imported raw data with a line added at the top containing titles for each column. |
[[Image:CG3Ch6F22.png|thumb|none|500px|''Raw data in Calc'']] | [[Image:CG3Ch6F22.png|thumb|none|500px|''Raw data in Calc'']] | ||
| Line 36: | Line 40: | ||
The first argument is the cell area with the times of all approximately 38,000 emails. The second argument is the cell area E2:E25 that describes the frequency classes. To enter the formula, first select the cell area F2:F25, then enter the formula. Then finish the formula by using the key combination ''Shift+Ctrl+Enter''. This indicates to the program that you want to use a matrix formula. To indicate the matrix formula, the program uses curly brackets. | The first argument is the cell area with the times of all approximately 38,000 emails. The second argument is the cell area E2:E25 that describes the frequency classes. To enter the formula, first select the cell area F2:F25, then enter the formula. Then finish the formula by using the key combination ''Shift+Ctrl+Enter''. This indicates to the program that you want to use a matrix formula. To indicate the matrix formula, the program uses curly brackets. | ||
| − | This technique is most often known to advanced users | + | This technique is most often known only to advanced users. |
=== Solution with the DataPilot === | === Solution with the DataPilot === | ||
| − | With the DataPilot you can achieve the same result much | + | With the DataPilot you can achieve the same result much easier and faster. The solution is also possible for less advanced users. Starting with the raw data, you need only a few mouse clicks: |
<ol> | <ol> | ||
<li>Select the cell '''A1''' (or any other cell within the list).</li> | <li>Select the cell '''A1''' (or any other cell within the list).</li> | ||
| − | <li>Choose '''Data''' > '''DataPilot > Start '''and click '''OK'''.</li> | + | <li>Choose '''Data''' > '''DataPilot > Start''' and click '''OK'''.</li> |
<li>In the DataPilot:</li> | <li>In the DataPilot:</li> | ||
<ul> | <ul> | ||
| − | <li>Drag | + | <li>Drag '''time''' into the ''Row fields'' area.</li> |
| − | <li>Drag | + | <li>Drag '''date''' into the ''Data fields'' area.</li> |
</ul> | </ul> | ||
<li>Click '''More''' to show more options in the lower part of the dialog.</li> | <li>Click '''More''' to show more options in the lower part of the dialog.</li> | ||
| Line 54: | Line 58: | ||
[[Image:CG3Ch6F24.png|thumb|none|500px|''DataPilot dialog '']] | [[Image:CG3Ch6F24.png|thumb|none|500px|''DataPilot dialog '']] | ||
| − | <li>In this case we need to count the number of values, not their sum | + | <li>In this case we need to count the number of values, not their sum. Double-click on the field '''Sum – Date''' to open the Data Field dialog and select the function ''Count''.</li> |
[[Image:CG3Ch6F25.png|thumb|none|500px|''Properties of the data field'']] | [[Image:CG3Ch6F25.png|thumb|none|500px|''Properties of the data field'']] | ||
| Line 60: | Line 64: | ||
<li>Click '''OK'''. As an intermediate result you get a DataPilot table that has for every time within the raw data a separate line.</li> | <li>Click '''OK'''. As an intermediate result you get a DataPilot table that has for every time within the raw data a separate line.</li> | ||
| − | {{ | + | {{Note| This may be a very time-consuming process because of the large number of items. The time does not depend that much on the number of lines but rather on the number of rows needed for the table that contains the results.}} |
| − | <li>For grouping the rows, select the cell '''A4''' or any other cell | + | <li>For grouping the rows, select the cell '''A4''' or any other cell that contains a time.</li> |
<li>Choose '''Data > Group and Outline > Group''', select for the interval ''Hours'' and click '''OK'''. The result is now grouped according to hours.</li> | <li>Choose '''Data > Group and Outline > Group''', select for the interval ''Hours'' and click '''OK'''. The result is now grouped according to hours.</li> | ||
[[Image:CG3Ch6F26.png|thumb|none|500px|''properties for grouping according to hours'']] | [[Image:CG3Ch6F26.png|thumb|none|500px|''properties for grouping according to hours'']] | ||
</ol> | </ol> | ||
| − | |||
| − | |||
| − | |||
| − | |||
The next figure shows the Data Field dialog for the data field '''Number – Date'''. Click '''More''' and select as type ''% of column''. | The next figure shows the Data Field dialog for the data field '''Number – Date'''. Click '''More''' and select as type ''% of column''. | ||
| Line 76: | Line 76: | ||
[[Image:CG3Ch6F27.png|thumb|none|500px|''Data Field settings for relative values'']] | [[Image:CG3Ch6F27.png|thumb|none|500px|''Data Field settings for relative values'']] | ||
| − | The result is shown below. | + | The result is shown below with absolute occurrence on the left. |
| − | + | ||
| − | + | ||
| + | {| | ||
| + | |- | ||
| + | |[[Image:CG3Ch6F28.png|thumb|none|500px|''Frequency distribution with the DataPilot'']] | ||
| + | |[[Image:CG3Ch6F29.png|thumb|none|500px|'' Relative occurrence'']] | ||
| + | |} | ||
Whether the relative values are shown as a decimal (0.1) or as a percentage (10%) depends only on the cell formatting itself and has nothing to do with the DataPilot. | Whether the relative values are shown as a decimal (0.1) or as a percentage (10%) depends only on the cell formatting itself and has nothing to do with the DataPilot. | ||
| − | {{ | + | {{CCBYSA}} |
[[Category: Calc Guide (Documentation)]] | [[Category: Calc Guide (Documentation)]] | ||
Latest revision as of 06:00, 7 July 2018
For showing the frequency of incidents, Calc uses the function FREQUENCY. This formula has to be used in a so-called matrix formula. This is an advanced feature. Alternatively you can use the DataPilot, which requires almost no knowledge of spreadsheets.
In our example we want to investigate the number of emails that go to the Germanophone support mailing list (users@de.openoffice.org). We want to know how the activity on the list is distributed during the day.
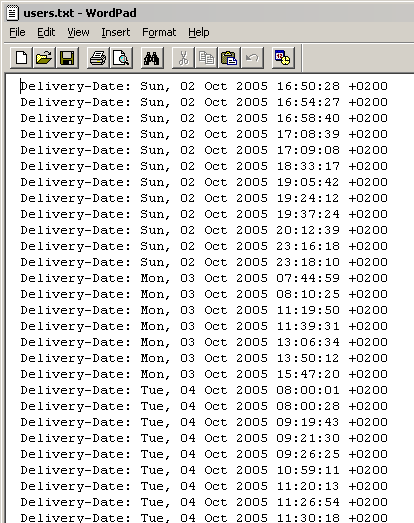
The starting point for this example is the mailbox file of the Thunderbird mail client. The command
grep 'Delivery-Date:' Inbox
creates a text file that contains for the timespan of more than 2 years one line for each message, with date and time.
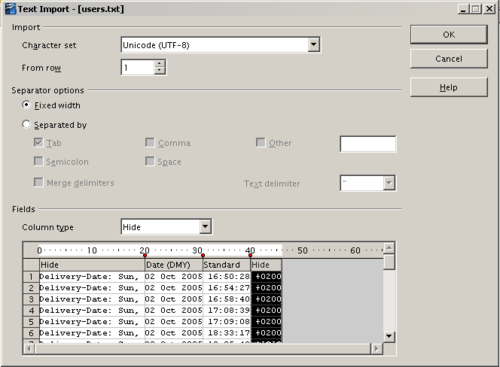
To import the data into a table in Calc, open the text file users.txt with the raw data. The Text Import dialog appears; here you can choose your import options. Use the following properties:
Separator options: Fixed width
Divide into columns at position 20, 31 and 40
Column types:
Column 1: Hide
Column 2: Date (DMY)
Column 3: Standard
Column 4: Hide
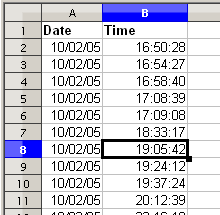
The figure below shows the imported raw data with a line added at the top containing titles for each column.
Solution with a matrix formula
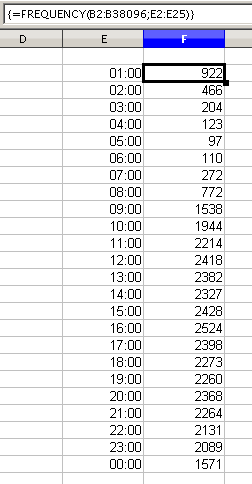
To calculate the frequency you have to create 24 classes, one for each hour. In the next column you enter the number of emails with the function FREQUENCY.
The first argument is the cell area with the times of all approximately 38,000 emails. The second argument is the cell area E2:E25 that describes the frequency classes. To enter the formula, first select the cell area F2:F25, then enter the formula. Then finish the formula by using the key combination Shift+Ctrl+Enter. This indicates to the program that you want to use a matrix formula. To indicate the matrix formula, the program uses curly brackets.
This technique is most often known only to advanced users.
Solution with the DataPilot
With the DataPilot you can achieve the same result much easier and faster. The solution is also possible for less advanced users. Starting with the raw data, you need only a few mouse clicks:
- Select the cell A1 (or any other cell within the list).
- Choose Data > DataPilot > Start and click OK.
- In the DataPilot:
- Drag time into the Row fields area.
- Drag date into the Data fields area.
- Click More to show more options in the lower part of the dialog.
- Choose – new sheet – for Results to.
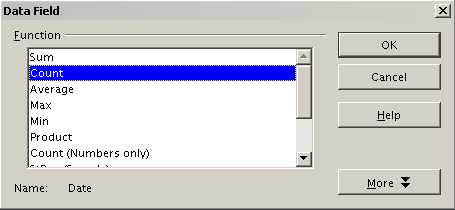
- In this case we need to count the number of values, not their sum. Double-click on the field Sum – Date to open the Data Field dialog and select the function Count.
- Click OK. As an intermediate result you get a DataPilot table that has for every time within the raw data a separate line.
- For grouping the rows, select the cell A4 or any other cell that contains a time.
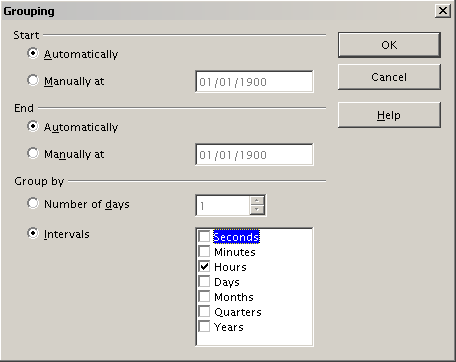
- Choose Data > Group and Outline > Group, select for the interval Hours and click OK. The result is now grouped according to hours.
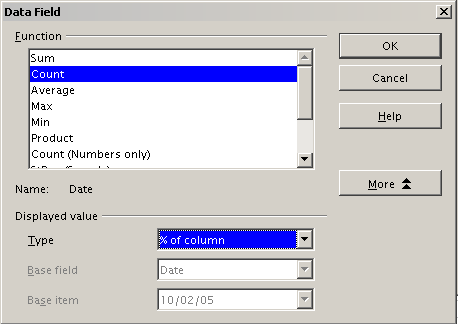
The next figure shows the Data Field dialog for the data field Number – Date. Click More and select as type % of column.
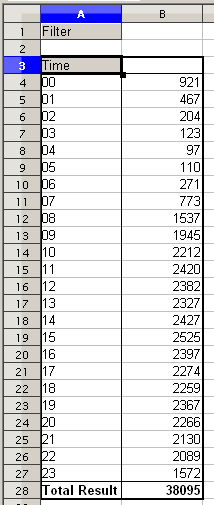
The result is shown below with absolute occurrence on the left.
Whether the relative values are shown as a decimal (0.1) or as a percentage (10%) depends only on the cell formatting itself and has nothing to do with the DataPilot.
| Content on this page is licensed under the Creative Common Attribution-Share Alike 3.0 license (CC-BY-SA). |
