Working with the results of the DataPilot
One very important feature is the flexibility of the DataPilot. An analysis can be changed with only a few mouse clicks. Some functions of the DataPilot can be used only with the results of an analysis.
Start the dialog
Right-click in the area of the resulting table of the DataPilot and choose Start to open the DataPilot dialog with all current settings.
Change layout by using drag and drop
The easiest and fastest method to change the layout of the DataPilot is drag and drop. Within the result table of the DataPilot just move one of the page, column, or row fields in a different position. The section Examples with step by step descriptions contains some examples.
You can remove a column, row, or page field from the DataPilot by clicking on and dragging it out of the DataPilot.
Grouping rows or columns
For many analyses or summaries, the categories have to be grouped. You can merge the results in classes or periods. In the DataPilot you do a grouping after you have first made an ungrouped DataPilot table.
You can access the grouping with the menu entry Data > Group and Outline > Group or by pressing F12. It is important that you select the correct cell area. The grouping function is mainly determined by the type of values that have to be grouped. You need to distinguish if you have scalar values, date or time values, or other values such as text that you want grouped.
Grouping of categories with scalar values
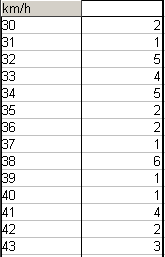
For grouping scalar values, select a single cell in the row or column of the category to be grouped.
Choose Data > Group and Outline > Group or press F12; you get the following dialog.
You can define in which value range (start/end) the grouping should take place. The default setting is the whole range from smallest to biggest value. In the Grouping after field you can enter the class size, this means the interval size (in this example groups of 10 km/h each).
Grouping of categories with date or time values
For grouping date or time values select a single cell in the column or row of the category that should be grouped. This was demonstrated in all three examples in the section Examples with step by step descriptions.
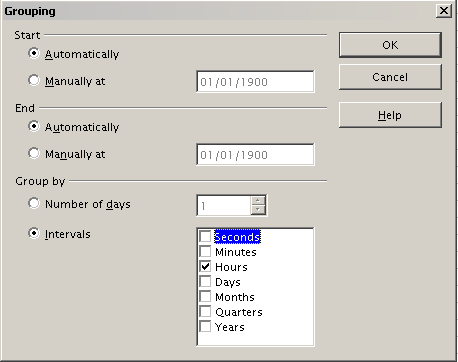
With the menu entry Data > Group and Outline > Group or by pressing F12, you get the following dialog.
You can decide in which date or time area (start/end) the grouping should take place. The default setting is the whole area from the earliest to the latest value. In the Group by field you can enter the class size (the interval size) that should be used for grouping.
Possible intervals are: seconds, minutes, hours, days, months, quarters and years. These can be combined, for example grouping of years and within the years according to months.
As alternative you can enter any number of days as grouping interval.
| For grouping the DataPilot in calendar weeks, define the beginning as a Sunday or Monday and manually enter the grouping interval of 7 days. |
Grouping without the automatic creation of intervals
If the categories contain text fields, then the automatic creation of intervals isn't possible. You can define for each category of any data type which categories you want to put together in one group.
Every time you use the menu entry Data > Group and Outline > Group or you press F12 and you have more than one cell selected, then all the cells will be selected as one group.
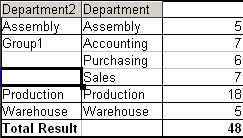
For grouping of non scalar categories, select in the result of the DataPilot all single categories that you want to put in one group.
| You can select several non-contiguous cells in one step by pressing and holding the Control key while left-clicking with the mouse. |
Choose the Data > Group and Outline > Group from the Menu bar or press F12. Repeat this for all groups that you want to create from the different categories.
You can change the automatically given names for the groups and the newly created group field by right-clicking on a name. The DataPilot will remember these settings, even if you change the layout later on. For the following pictures, the dialog was called again (with a right-click) and within the preferences menu the Automatic option was selected.
| Content on this page is licensed under the Creative Common Attribution-Share Alike 3.0 license (CC-BY-SA). |


