Difference between revisions of "Documentation/How Tos/Calc: PEARSON function"
From Apache OpenOffice Wiki
< Documentation | How Tos
m |
|||
| (12 intermediate revisions by 5 users not shown) | |||
| Line 1: | Line 1: | ||
| − | __NOTOC__ | + | {{DISPLAYTITLE:PEARSON function}} |
| + | {{Documentation/CalcFunc StatisticalTOC | ||
| + | |ShowPrevNext=block | ||
| + | |PrevPage=Documentation/How_Tos/Calc:_INTERCEPT_function | ||
| + | |NextPage=Documentation/How_Tos/Calc:_RSQ_function | ||
| + | }}__NOTOC__ | ||
== PEARSON == | == PEARSON == | ||
| Line 13: | Line 18: | ||
:<tt>'''PEARSON'''</tt> calculates: | :<tt>'''PEARSON'''</tt> calculates: | ||
::[[Image:Calc_pearson_equation.png]] | ::[[Image:Calc_pearson_equation.png]] | ||
| + | :: where [[Image:Calc_xymean.png]] are the averages of <i>x</i>,<i>y</i>. | ||
: <i>Advanced topic:</i> | : <i>Advanced topic:</i> | ||
| − | : The parameters <tt>'''x'''</tt> and <tt>'''y'''</tt> are always evaluated as [[Documentation/How_Tos/Using Arrays|array formulas]]. | + | : The parameters <tt>'''x'''</tt> and <tt>'''y'''</tt> are always evaluated as [[Documentation/How_Tos/Using Arrays|array formulas]]. |
=== Example: === | === Example: === | ||
| Line 21: | Line 27: | ||
: returns the Pearson correlation coefficient for the two sets of data in A1:A30 and B1:B30. | : returns the Pearson correlation coefficient for the two sets of data in A1:A30 and B1:B30. | ||
| − | === | + | === Issues: === |
| − | + | * <tt>'''PEARSON'''</tt> is identical to <tt>'''CORREL'''</tt>. | |
| − | [[Documentation/How_Tos/Calc: | + | {{SeeAlso|EN| |
| + | * [[Documentation/How_Tos/Calc: CORREL function|CORREL]] | ||
| + | * [[Documentation/How_Tos/Calc: RSQ function|RSQ]] | ||
| − | + | * [[Documentation/How_Tos/Calc: Statistical functions|Statistical functions]] | |
| − | * | + | |
| + | * [[Documentation/How_Tos/Calc: Functions listed alphabetically|Functions listed alphabetically]] | ||
| + | * [[Documentation/How_Tos/Calc: Functions listed by category|Functions listed by category]]}} | ||
| + | [[Category: Documentation/Reference/Calc/Statistical functions]] | ||
Latest revision as of 14:44, 2 February 2024
Spreadsheet Lookup functions
Measures of dispersion / spread
Probability and statistics
Correlation and line fitting
See also (in the Arrays Functions category); GROWTH, LINEST, LOGEST, TREND
Ranking
PEARSON
Returns the Pearson correlation coefficient of two sets of data.
Syntax:
PEARSON(x; y)
- where x and y are ranges or arrays containing the two sets of data.
- Any text or empty entries are ignored.
- PEARSON calculates:
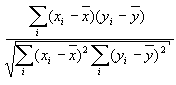
- where
 are the averages of x,y.

- Advanced topic:
- The parameters x and y are always evaluated as array formulas.
Example:
PEARSON(A1:A30; B1:B30)
- returns the Pearson correlation coefficient for the two sets of data in A1:A30 and B1:B30.
Issues:
- PEARSON is identical to CORREL.
See Also