Editing Pictures
Eyedropper
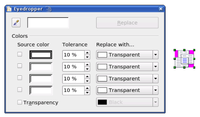
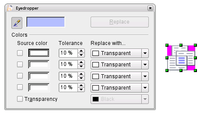
Use the eyedropper to change one color in a picture for another or set the color as transparent. The tool always works on the entire picture; you cannot select only a region for editing.
The changes are carried out on the graphic itself and therefore require it to be embedded. Attempts to use the eyedropper tool on a linked graphic result in the following message: This graphic is linked to a document. Do you want to unlink the graphic is order to edit it?
The tool can be used on all raster graphic formats and with many Metafile formats.
Practical example: Changing wrong colors to transparency
Some applications, which cannot correctly handle transparency, show transparent areas with the color Magenta and then store the graphic with this color and without the correct transparency information.
Bitmap graphic with area in magenta, which actually should be shown transparent. On the left is the original picture, right is the picture after saving it with MS Paint.
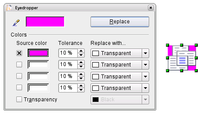
If you receive such a picture, you can recreate the transparency with the eyedropper tool.
The dialog does not close automatically, so you can carry out further color replacements. Mark first the field for the Source color and choose again the color with the eyedropper. Close the dialog with Ctrl+F4 or the Close icon on the window border. Draw uses an Alpha channel for transparency so that pixels of different colors can be made transparent.
It is also possible to carry out the operation in reverse to change a transparent area to a color. Select nothing in the graphic but choose the Transparency option at the lower left of the dialog and the replacement color at the lower right.
The selection list for replacement colors shows all the available colors in the current color palette of the document. You cannot define any new colors here but you can add colors to the available palette before using the eyedropper tool. For more on this topic, see Tips and Tricks.
Effect of the tolerance parameter
The tolerance parameter describes how closely a color value in the picture must agree with the source color in order to be replaced. In the figure below, the red color tone at the left edge of the rectangular color palette is used as the source color and a pure blue as the replacement color with several different tolerances. The original is a rectangle with color palette from red to green. Because the eyedropper is not usable on drawings, the rectangle on the left side was converted into a raster graphic (Convert > Bitmap). The picture was then exported in a Enhanced Metafile format and inserted on the right.
| The application of transparency and color replacement effects on raster graphics and Metafiles leads to quite different results. This is a known problem, which will be corrected in a future version. |
Color depth
-
-
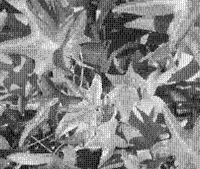
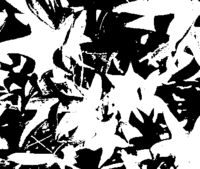
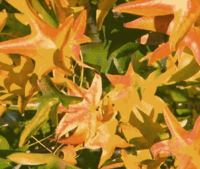
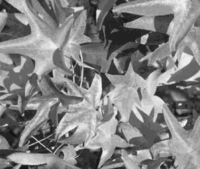
- It is possible to reduce the color depth in OOo. The tools are available but you must create a separate menu and add the tools to the menu if you wish to have them available (refer to OOo help if you are not sure how to do this). To find the tools, click on Tools > Customize, Toolbars, and Add (Command). The commands are in the category Modify, at the top of the list.
-
Reducing color depth
Conversion
Convert to a contoured image
Select the picture so you see the green handles. From the context menu or from the Modify menu choose Convert > to Contour. This command creates from the original image a polygon or group of polygons, with four corner points and the image set as a background graphic. In this state you are not able to further edit the graphic. All your modifications must be completed before this point.
The polygon is in fact a vector graphic but the picture remains as a bitmap image. Using a polygon offers possibilities for further change; for example, you can modify the shape or define a transparency gradient.
Convert to a polygon
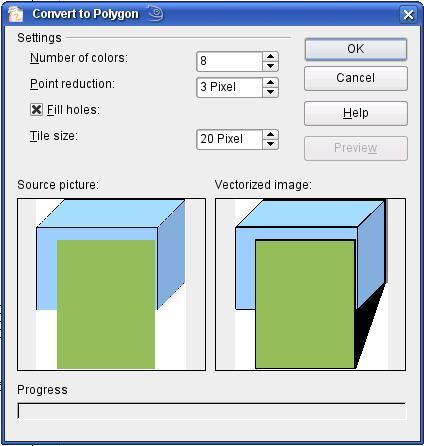
Select the picture so you see the green handles. From the context menu or from the Modify menu, choose Convert > to Polygon. This command converts areas of the same color into small filled polygons. The total image becomes a vector graphic and can be resized with no loss of image quality or distortion of text. The resulting format will be a Metafile.
The Convert to Polygon dialog has a number of settings which can be tested using the Preview button. Because graphics conversion can take some time, depending on the picture and the computer, a progress bar is included at the bottom of the dialog.
Number of colors
Draw considers between 8 and 32 colors in the conversion. The picture can, however, contain fewer colors than 8. For every color occurring in the picture, Draw creates a polygon, which may consist of several disconnected parts. These polygons are then filled with the relevant color.
The algorithm used to reduce the number of colors in the picture to the number specified is not yet optimal. For this reason you may prefer to try reducing the number of colors by changing the color depth or with the Posterize filter from the Graphic Filter toolbar.
Point reduction
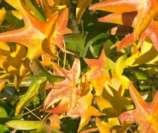
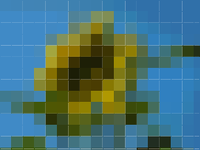
Polygons will only be created if they have a size greater than the value given in this setting. The section of the picture below, highly magnified, shows that with a larger point count small flecks of color — typical of irregular color patterns — simply disappear.
Fill holes
Point reduction can result in small areas or "holes" which are not covered by a polygon. If the Fill holes option is marked, additional square, tiled areas are created with a background color the same as the hole. The Tile size option allows the width in pixels of the width of these square areas to be preset.
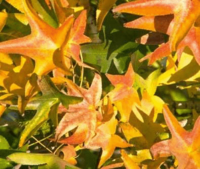
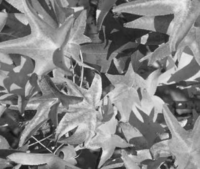
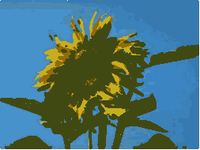
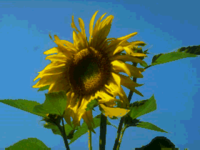
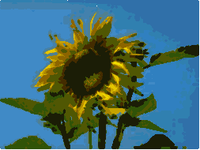
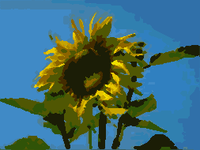
| Here the picture is transformed with the Poster filter, but this time with a point reduction of 4 pixels and a tile size of 16 pixels. | The effect below was generated from the picture to the left (posterized and vectorized); the polygons were split with Modify > Break, and a number (in this case 6) of the (foreground) polygons were deleted until the resulting background was achieved.
Note: To select polygons for deletion, click on a curved colored area (the text in the status bar shows "Polygon nnn corners selected", where nnn is the number of corners of the polygon) and a frame with green handles encloses the area of the polygons selected. Press Delete to delete the polygons. Repeat until you have achieved the desired effect, (which here is to have only the background showing). |
If you next 'split' the existing Metafile (Modify > Split), access is gained to individual polygons. To be able to operate on these together you should immediately group them after splitting.
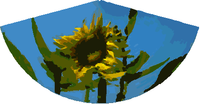
With this vectorized form of the image, you can carry out operations familiar from classic drawing programs, for example a curved warping operation. For such transformations, it is much less effort to use a conversion with background tiles so that the edges of the picture are straight.
Using the graphic generated in the posterize and vectorize process above, Break and Split it, and then try out some operations using the tools on the Effects toolbar.
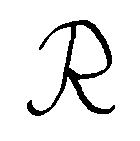
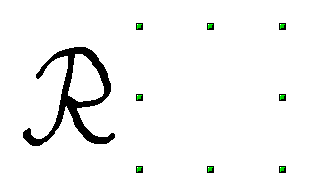
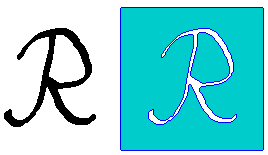
To use this tool to vectorize the first letter of a chapter in a special font, convert the graphic to a polygon, using no point reduction or background tiling. Use Modify > Break to generate two polygons. An example is shown below.
Convert to bitmap
All drawing objects are vector graphics. Use the command Convert > To Bitmap from the context menu to convert a vector graphic to a raster graphic. Draw creates the raster graphic in PNG format with a color depth of 24 bits. Unfortunately any transparency effects which were created in the vector graphic are lost in this conversion, although the PNG format used in Draw does support transparency. Only if you use the eyedropper tool to set transparency will an Alpha channel also be produced.
To determine the height and width of the converted graphic (number of pixels), Draw considers the dpi setting of the operating system for the screen and the percentage scaling factor set under Tools > Options > OpenOffice.org > View in the section User Interface.
Example:
Width of vector graphic: 1.5 inchMonitor setting of operating system: 96 dpi ( = 96 dots per inch)Scaling 130 %
Calculation: 1.5 inch x 96 dpi *130% = 187 pixels
The actual number of pixels will vary somewhat from this value due to rounding. When the format permits, Draw uses a dpi value (in this case 125 dpi) which permits the calculation to be reversed and the picture with this pixel value reproduced with the correct width of 1.5 inch.
Print options with raster graphics
If you have a black and white printer or are experiencing problems with printing, you should have a look at the following settings.
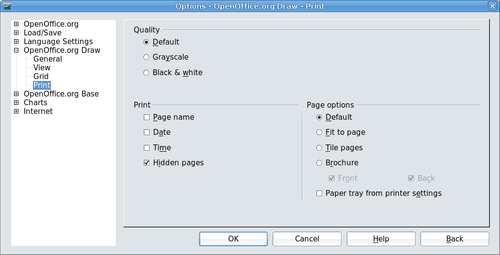
You can set up printing so that all text and all graphics are printed in grayscale or black and white. The general settings are in Tools > Options > OpenOffice.org Draw > Print in the section Quality. To set these for the current document only, use Options in the Print dialog (File > Print). With both Black/white printing and Grayscale printing, no background is printed.
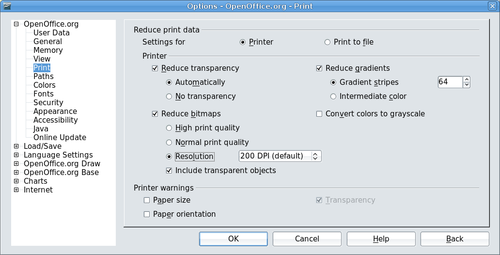
Other options are in Tools > Options > OpenOffice.org > Print . They relate to page options (scaling) and other printing variables. They affect the size of the print file and the time taken to print the document. With most modern systems you can simply accept the defaults. As different operating systems and printers have their own requirements, you need to tailor the settings to your particular site conditions. Refer to the Help file for more information.
| Content on this page is licensed under the Creative Common Attribution 3.0 license (CC-BY). |
