Introducing Draw
This is Chapter 1 of the OpenOffice.org 3 Draw Guide, produced by the ODFAuthors group.
A PDF of this chapter is available from this wiki page.
Drawing Vector Graphics in OpenOffice.org
Draw is a vector graphics drawing tool, although it can also perform some operations on raster graphics (pixels). Using Draw, you can quickly create a wide variety of graphical images.
Vector graphics store and display a picture as simple geometric elements such as lines, circles, and polygons rather than as a collection of pixels (points on the screen). This permits simpler storage and supports precise scaling of the picture elements.
Draw is fully integrated into the OpenOffice.org (OOo) suite, and this simplifies exchanging graphics with all components of the suite. For example, if you create an image in Draw, reusing it in a Writer document is as simple as copying and pasting the image. You can also work with drawings directly from within Writer or Impress, using a subset of the functions and tools from Draw.
Draw’s functionality is extensive, and even though it was not designed to rival high-end graphics applications, it possesses significantly more functionality than the drawing tools that are generally integrated with most office productivity suites.
A few examples of the drawing functions are: layer management, magnetic grid-point system, dimensions and measurement display, connectors for making organization charts, 3D functions that enable small three-dimensional drawings to be created (with texture and lighting effects), drawing and page-style integration, and Bézier curves.
The Draw Guide is not a course book to be worked through from beginning to end. Rather, it is a reference work in which you can browse for guidance on particular topics.
This document describes only the functions associated with Draw. Some concepts, such as file management or the way the OpenOffice.org environment works, are mentioned only briefly; they are covered in more detail in the Getting Started guide.
The Draw workplace
The main components of the Draw interface are shown in Figure 1.
The large area in the center of the window is where you make the drawings. You can surround the drawing area with toolbars and information areas. The number and position of the visible tools vary with the task in hand and user preferences. Therefore, your setup may look different. For example, many users put the main Drawing toolbar on the left-hand side of the workspace—not at the bottom, as shown here. The setup procedure is described in detail in Chapter 4 (Menus and Toolbars) in the Getting Started guide.
You can split drawings in Draw over several pages. Multi-page drawings are used mainly for presentations. The Pages pane, on the left side of the Draw window in Figure 1 gives an overview of the pages that you create. If the Pages pane is not visible on your setup, you can enable it from the View menu (View > Page Pane). To make changes to the page order, just drag and drop one or more pages.
In Draw 3, the maximum size of a drawing page is 300 cm by 300 cm.
Rulers
You should see rulers (bars with numbers) on the upper and left-hand sides of the workspace. If they are not visible, you can enable them by selecting them from the View menu (View > Ruler).
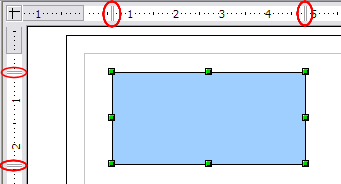
The rulers show the size of a selected object on the page (see the gray double lines, highlighted in Figure 2). When no object is selected, they show the location of the mouse pointer, which helps to position drawing objects more accurately.
You can also use the rulers to manage object handles and guide lines, making it easier to position objects.
The page margins in the drawing area are also represented on the rulers. You can change the margins directly on the rulers by dragging them with the mouse.
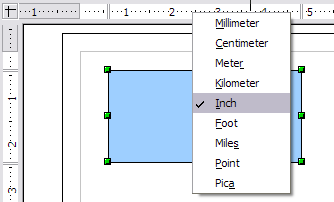
To modify the units of measurement of the rulers (which you can define independently), right-click on the desired ruler, as illustrated for the horizontal ruler in Figure 3.
Status bar
The Status bar is located at the bottom of the screen (in all OOo components) and includes several Draw-specific fields, as identified in Figure 4.
The Information field shows which action is being carried out, or which object type is selected.
The Position field shows different information, depending on whether objects are currently selected or not:
- When no object is selected, the left number pair shows the current position (in X,Y Cartesian coordinates) of the mouse cursor.
- While an object is being resized with the mouse, the right number pair shows the size of the object (width and height).
- If an object is selected, the left number pair shows the X,Y coordinates of the upper-left corner, and the right number pair displays the size of the object, as seen in Figure 4. These numbers do not relate to the object itself, but to the selection outline, which is the smallest possible rectangle that can contain the visible part or parts of the object; see also Chapter 3 (Working with Objects and Object Points).
- When an object is selected, a double-click on this field opens the Position and Size dialog, which is described in detail in Chapter 4 (Changing Object Attributes).
In the Indicator field, an asterisk (*) is shown whenever any change is made to the document but not yet saved to disk.
If you wish to digitally sign the document, a double-click or right-click in the Signature field brings up the signature box. Note that a document must be saved at least once before it can be signed. After it is signed, an indicator is present in this field.
The Slide field shows the sequence number for the current drawing page, in addition to the total number of pages that you created so far. This is useful when your drawing has a number of pages. If you select an object, the field enclosed by parentheses shows the layer in which the object resides within the drawing. In the example of Figure 4, the object is on the Layout layer of Slide 1, and there is a total number of one slide, so far.
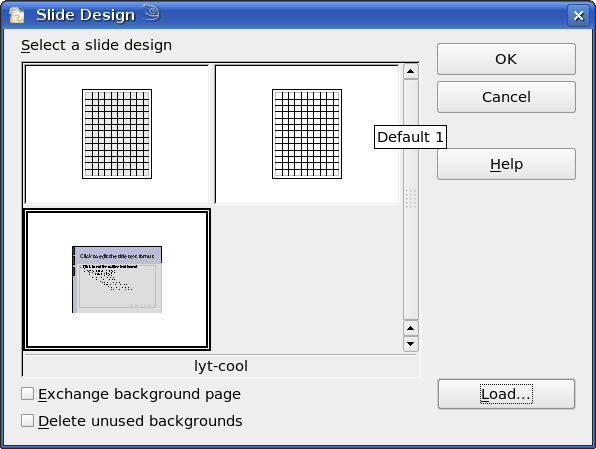
The Template field shows which page template is being used for the current page. If you saved several slide designs, you can select one for the current page by double-clicking in this field (see Figure 5) and selecting Load after choosing a slide design.
The vertical bar in the middle of the Zoom slider represents a zoom factor of 100%. To change the view magnification, drag the Zoom slider, or click on the + and – signs, or right-click on the zoom level percent to pop up a list of magnification values from which to choose. Double-clicking on the zoom level percent to open the Zoom & View Layout dialog.
Toolbars
You can display or hide the various Draw toolbars, according to your needs. To display or hide a toolbar, click View > Toolbars. On the menu that appears, choose which toolbars you want to display.
You can also select the icons that you wish to appear on the toolbars. Toolbars display a default selection of icons but you can choose to hide some of these and display others. To change the visible icons on any toolbar, click the arrow at the right-hand end of the toolbar and select Visible Buttons. On the list of the available icons that appears, select or deselect the icons you want to be visible. A checkmark next to an icon indicates that it is visible.
The tools available in the various toolbars are explained in the following sections.
Standard toolbar
The Standard toolbar is the same for all OOo components and is not described in detail here.
Line and Filling toolbar
The Line and Filling toolbar lets you modify the main properties of a drawing object: the icons and pull-down lists vary, according to the type of object selected. For example, to change the thickness of a line with the spinner, hover the mouse over the spinner and click the up or down arrow to achieve the desired thickness.
In the example above, the available functions enable you to change the color, style, and width of the line drawn or the fill color, style, and other properties of an object. The object must first be selected with a mouse click. If the selected object is a text frame, the buttons for line style and fill color are changed to Invisible.
When text is selected, the Line and Filling toolbar changes to the Text Formatting toolbar, which is very similar to the Formatting toolbar in Writer. A more detailed explanation of the buttons on this toolbar can be found in Chapter 4 (Changing Object Attributes).
Drawing toolbar
The Drawing toolbar is the most important toolbar in Draw. It contains all the necessary functions for drawing various geometric and freehand shapes and for organizing them on the page. It is described in detail in Chapter 2 (Drawing Basic Shapes).
Color bar
To display the Color bar, use View > Toolbars > Color Bar. The toolbar then appears at the bottom of the workspace and displays the current color palette.
This toolbar lets you rapidly choose the color of the various objects (lines, areas, and 3D effects) in your drawing. The first box in the panel corresponds to transparency (no color).
Choosing a color palette
You can access several specialized color palettes in Draw, as well as change individual colors to your own taste. This is done using the Area dialog, reached by choosing Format > Area, as shown in Figure 11, or the pouring can icon on the Line and Filling toolbar (Figure 7).
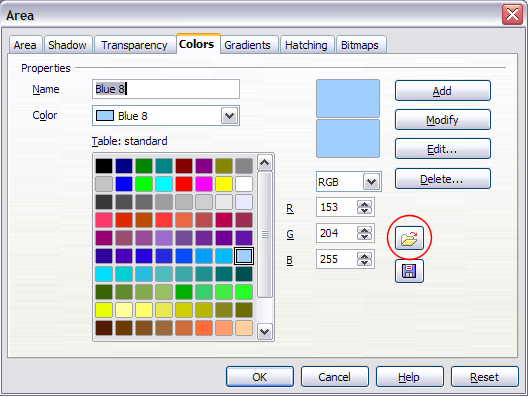
On the Area dialog, choose the Colors tab (Figure 12).
To load another palette, click on the Load Color List button (circled). The file selector dialog asks you to choose one of the standard OOo palettes (files bearing the file extension *.soc). For example, web.soc is a color palette that is particularly adapted to creating drawings that are going to appear in Web pages. The colors will correctly display on workstations with screens displaying at least 256 colors.
A more detailed description of color palettes and their options can be found in Chapter 8 (Tips and Tricks).
Options toolbar
The Options toolbar lets you activate or deactivate various drawing aids. The Options Bar is not one of the toolbars displayed by default. To display it, select View > Toolbars > Options.
The options are described in the table below and in greater detail in other chapters of the Draw Guide.
Table 1: Functions on the Options toolbar
Drawing grid and guides
Draw offers a grid as a drawing aid. The grid can be turned on or off by clicking on the Grid icon on the Options toolbar. The points of the grid displayed on the screen are not shown on the printed drawing. The color, spacing, and resolution of the grid points can be individually chosen for each axis. This is described in more detail in Chapter 8 (in the section titled “Configuring the grid”).
Guides are special “helper lines” that can be turned on or off by clicking on the Guides icon on the Options toolbar. Draw offers a “Snap” function, with which you can place drawings exactly on these guides or on a grid point, a page margin, or a border or point of another object. All snap functions are described in detail in Chapter 8 (Tips and Tricks).
Showing the position of the object while moving it makes positioning the object much easier. If the Guides function is activated, pairs of vertical and horizontal lines enclosing the object are shown while moving the object. These lines extend to the edges of the drawing area. This function is also described in detail in Chapter 8.
Floating and moving toolbars
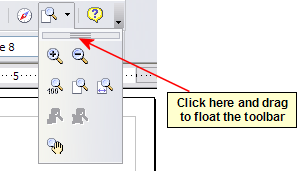
Many toolbar icons are marked with a small arrow. The arrow indicates that this icon has additional functions. Click the arrow, and a submenu appears, showing its additional functions (see Figure 14). Such an icon, and its associated submenu, can become a floating toolbar. Click the area at the top of the submenu, drag it across the screen to a location you want, and then release the mouse button. Floating toolbars can be redocked on an edge of the screen or within one of the existing toolbar areas at the top of the screen, as described in Chapter 4 (Changing Object Attributes). The floating-toolbar capability is common to all components of OOo.
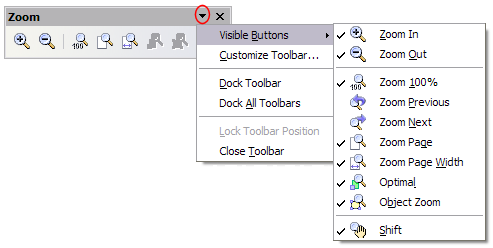
Similarly, click on the arrow on the title bar of a floating toolbar to display additional functions (see Figure 15).
To show or hide icons defined for the selected toolbar, choose Visible Buttons from the drop-down menu. Visible icons have a checkmark next to them. Click on icons to select or deselect them.
In Draw, as in all OOo components, you can move a toolbar to a new position by using the mouse. Hover the mouse pointer over the vertical column of dots at the left end of the toolbar until the pointer changes shape, and then drag-and-drop as desired.
Customizing toolbars
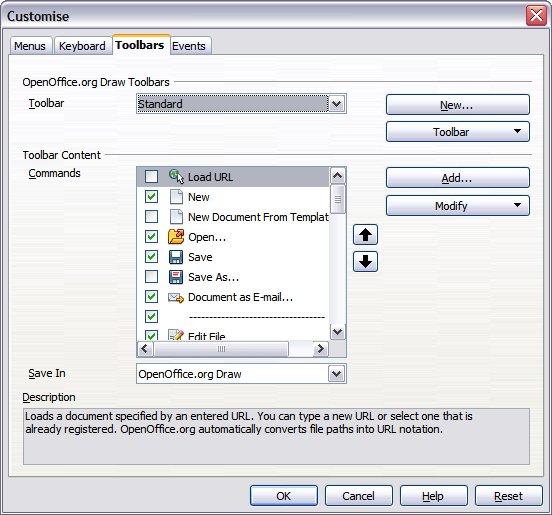
You can customize toolbars in several ways, in addition to those described in the previous section. For example, you can add functions to a toolbar, move tools between toolbars, and create new toolbars. To do this, choose View > Toolbars > Customize, select the Toolbars tab (Figure 16) and the toolbar you want to change, and then select the desired buttons for that toolbar. Each toolbar has a different list of buttons. For details, see Chapter 14 (Customizing OpenOffice.org) in the Getting Started guide. That chapter also describes how to customize menus.
| Content on this page is licensed under the Creative Common Attribution 3.0 license (CC-BY). |

