Difference between revisions of "Documentation/How Tos/Calc: TREND function"
From Apache OpenOffice Wiki
< Documentation | How Tos
m |
|||
| Line 1: | Line 1: | ||
| − | {{Documentation/ | + | {{Documentation/CalcFunc ArraysTOC |
| − | | | + | |ShowPrevNext=block |
| − | + | |PrevPage=Documentation/How_Tos/Calc:_TRANSPOSE_function | |
| − | + | |NextPage=Documentation/How_Tos/Calc:_COMPLEX_function | |
| − | + | }}__NOTOC__ | |
| − | + | ||
| − | + | ||
| − | + | ||
| − | |PrevPage= Documentation/How_Tos/Calc:_TRANSPOSE_function | + | |
| − | | | + | |
| − | + | ||
| − | + | ||
| − | + | ||
| − | + | ||
| − | + | ||
| − | + | ||
| − | + | ||
| − | + | ||
| − | + | ||
| − | + | ||
| − | + | ||
| − | + | ||
| − | + | ||
| − | + | ||
| − | + | ||
| − | + | ||
| − | + | ||
| − | + | ||
| − | + | ||
| − | }} | + | |
| − | + | ||
== TREND == | == TREND == | ||
Revision as of 16:19, 29 January 2024
TREND
Fits a straight line to data using linear regression and returns points on that line.
Syntax:
TREND(yvalues; xvalues; new_xvalues; type)
- yvalues and xvalues are single row or column ranges specifying points in a set of data.
- TREND fits a straight line through these data points, using the linear regression method.
- If type is 0 the straight line found will pass through the origin; if type is non-zero or omitted the best fit straight line will be found.
- TREND returns an array of the y values of the straight line found, corresponding to the x values in new_xvalues (or if omitted xvalues). It must be entered as an array formula (for example by using Cntrl-Shift-Enter rather than just Enter).
- yvalues and xvalues must be the same size. new_xvalues may have a different size.
Example:
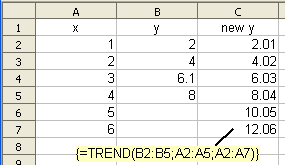
=TREND(B2:B5; A2:A5; A2:A7)
- when entered as an array formula in cell C2, where the x values in A2:A7 are 1,2,3,4,5, 6 and the y values in B2:B4 are 2, 4, 6.1, 8 returns {2.01|4.02|6.03|8.04|10.05|12.06}. The data points are very nearly on the line y = 2x (and would be if B4 contained 6 instead of 6.1). The best fit line found is therefore very nearly y=2x.
- This example shows how TREND may be used to predict future values.
See Also
