Difference between revisions of "Documentation/How Tos/Calc: LOGEST function"
From Apache OpenOffice Wiki
< Documentation | How Tos
m |
|||
| (One intermediate revision by the same user not shown) | |||
| Line 1: | Line 1: | ||
| − | {{ | + | {{DISPLAYTITLE:LOGEST function}} |
| − | + | {{Documentation/CalcFunc ArraysTOC | |
| − | + | |ShowPrevNext=block | |
| − | + | |PrevPage=Documentation/How_Tos/Calc:_LINEST_function | |
| − | + | |NextPage=Documentation/How_Tos/Calc:_MDETERM_function | |
| − | | | + | }}__NOTOC__ |
| − | + | ||
| − | + | ||
| − | |PrevPage= Documentation/How_Tos/Calc:_LINEST_function | + | |
| − | | | + | |
| − | + | ||
| − | + | ||
| − | + | ||
| − | + | ||
| − | + | ||
| − | + | ||
| − | + | ||
| − | + | ||
| − | + | ||
| − | + | ||
| − | + | ||
| − | + | ||
| − | + | ||
| − | + | ||
| − | + | ||
| − | + | ||
| − | + | ||
| − | + | ||
| − | + | ||
| − | }} | + | |
| − | + | ||
== LOGEST == | == LOGEST == | ||
| Line 46: | Line 21: | ||
: if <tt>'''allow_const'''</tt> is <tt>'''FALSE'''</tt> the constant ''a'' is forced to be one; ''y'' = ''b<sup>x</sup>''. If omitted, <tt>'''allow_const'''</tt> defaults to <tt>'''TRUE'''</tt> (a value for ''a'' is found). | : if <tt>'''allow_const'''</tt> is <tt>'''FALSE'''</tt> the constant ''a'' is forced to be one; ''y'' = ''b<sup>x</sup>''. If omitted, <tt>'''allow_const'''</tt> defaults to <tt>'''TRUE'''</tt> (a value for ''a'' is found). | ||
| − | : <tt>'''LOGEST'''</tt> returns a table (array) of statistics as below and must be entered as an [[Documentation/How_Tos/Using Arrays|array formula]] (for example by using | + | : <tt>'''LOGEST'''</tt> returns a table (array) of statistics as below and must be entered as an [[Documentation/How_Tos/Using Arrays|array formula]] (for example by using {{key|Cntrl|Shift|Enter}} rather than just {{key|Enter}}) |
: If <tt>'''stats'''</tt> is omitted or <tt>'''FALSE'''</tt> only the top line of the statistics table is returned. If <tt>'''TRUE'''</tt> the entire table is returned. The statistics relate to the equation for ln(''y'') given above. | : If <tt>'''stats'''</tt> is omitted or <tt>'''FALSE'''</tt> only the top line of the statistics table is returned. If <tt>'''TRUE'''</tt> the entire table is returned. The statistics relate to the equation for ln(''y'') given above. | ||
| Line 52: | Line 27: | ||
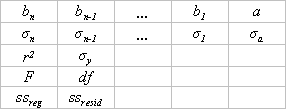
[[Image:Calc_linest_output.png|right]] | [[Image:Calc_linest_output.png|right]] | ||
| − | : ''b<sub>1</sub>'' to ''b<sub>n</sub>'' and ''a'' are the | + | : ''b<sub>1</sub>'' to ''b<sub>n</sub>'' and ''a'' are the coefficients for the equation above. |
: ''σ<sub>1</sub>'' to ''σ<sub>n</sub>'' are the standard error values for the ln(''b'') values; ''σ<sub>a</sub>'' is the standard error value for the ln(''a'') value. | : ''σ<sub>1</sub>'' to ''σ<sub>n</sub>'' are the standard error values for the ln(''b'') values; ''σ<sub>a</sub>'' is the standard error value for the ln(''a'') value. | ||
Latest revision as of 11:06, 30 January 2024
LOGEST
Returns a table of statistics for an exponential curve that best fits a data set.
Syntax:
LOGEST(yvalues; xvalues; allow_const; stats)
- yvalues is a single row or column range specifying the y coordinates in a set of data points.
- xvalues is a corresponding single row or column range specifying the x coordinates. If xvalues is omitted it defaults to 1, 2, 3, ..., n. If there is more than one set of x variables, xvalues may be a range with corresponding multiple rows or columns.
- LOGEST finds an exponential curve y = a . bx that best fits the data. With more than one set of variables the curve is of the form y = a . b1x1 . b2x2 ... . bnxn.
- In order to fit the curve, LOGEST uses linear regression (the "least squares" method) based on the equation ln(y) = ln(a) + x1ln(b1) + x2ln(b2) + ... xnln(bn).
- if allow_const is FALSE the constant a is forced to be one; y = bx. If omitted, allow_const defaults to TRUE (a value for a is found).
- LOGEST returns a table (array) of statistics as below and must be entered as an array formula (for example by using Cntrl + ⇧ Shift + ↵ Enter rather than just ↵ Enter )
- If stats is omitted or FALSE only the top line of the statistics table is returned. If TRUE the entire table is returned. The statistics relate to the equation for ln(y) given above.
- b1 to bn and a are the coefficients for the equation above.
- σ1 to σn are the standard error values for the ln(b) values; σa is the standard error value for the ln(a) value.
- r2 is the determination coefficient (RSQ); σy is the standard error value for the ln(y) estimate.
- F is the F statistic (F-observed value); df is the number of degrees of freedom.
- ssreg is the regression sum of squares; ssresid is the residual sum of squares.
Example:
- In the example above, cells A2:B6 contain the x,y values for a set of points. LOGEST(B2:B6;A2:A6;1;1) returns the statistics for a best fit exponential curve through those points.
Issues:
- You need a good understanding of the statistics involved.
- Any empty cells in the output array show #N/A (in Calc and Excel).
See Also

