Chart2
- Chart chapter in the Developers Guide
- Chart chapter in the BASIC Developers Guide
- OOo Community Forum on Calc
- Chart Specifications on OOo
- Chart Project Page on OOo
- Chart on GullFOSS
Chart2 is the re-implementation of the charting component of OpenOffice.org. It is integrated in OOo 2.3.
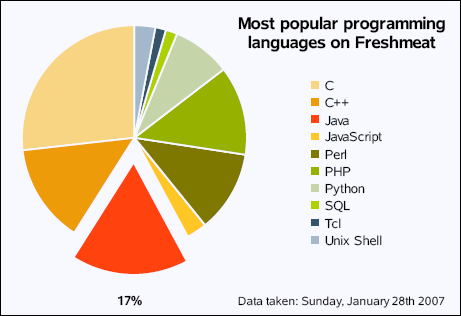
Charts are used for visualizing data sets from e.g. spreadsheets by two and three dimensional diagrams. There are a lot of different two- and three-dimensional chart types you can choose from. This page gathers information about the new chart implementation of OpenOffice.org. It is especially written to help newcomers to the process of developing for the new OOo chart module.
If you would like to participate, if you have comments or questions related to the chart you are welcome on the graphics mailing lists: (users,dev,features,bugs,cvs)@graphics.openoffice.org. See also the side-box with some useful Links.
Helping with the Chart

Development
If you like to help developing the chart, you can find useful information here.
- Since SRC680.m213, the master build contains the module chart2, so the procedure for developing code for the chart is the same as for every other project. For help on this see the Main Page.
- See the programming contribution page for details on how to start.
- C++ Coding Standards for developing OOo code.
- FAQ about Chart API Compatibility If you have problems with Macros or extensions that use the com.sun.star.chart API you may find answers or ask questions on this page.
- UNO API of the new Chart (chart2) (version of OOG680.m2, August 2007) Note, that the new API is not published yet. Do not use it for your regular work! For macros, use the API in namespace chart.
- The file format used for OpenOffice.org is the ODF format. Currently, ODF 1.1 is in use. The upcoming format ODF 1.2 is still in progress (see open action items).
If you want to help developing for the chart, you can find a list of open bugs and features in the section Testing.
Currently open child-workspaces for development:
| Name | Description | Target | Based on |
| chart15 | Bugfixes for chart2 | OOo 2.4 | SRC680.m226 |
| chart14 | chart features for OOo 2.4 | OOo 2.4 | SRC680.m225 |
Testing
The new chart implementation will be part of OpenOffice.org 2.3. A developer snapshot of the release candidates is available on the OOo download page. The localizations (CWS localisation21) and some final fixes for the chart (CWS chart12) are integrated into OOG680.m2.
If you want to help the QA team have a look at the QA contribution page.
For a current list of open issue for the Chart component see this complete query or a more specific one:
- Fixed issues that have not been verified or closed yet
- Open features (enhancements and features)
- Open bugs (defects and tasks)
- Patches that have not been applied yet
- Verified issues that have not been closed yet (checked in the master)
- Chart Issues in other components. Component is not Chart, but the summary contains the words diagram or chart.
- Or create your own query.
There is also a spreadsheet document containing the open chart issues. It is nice for sorting and filtering, but it is not up-to-date. Have a look at the first line to find out when the query was done.
Other Contributions
For other kinds of contributions like graphics, documentation, translation, marketing take a look at this page.
Features
This section gives an overview over new features that are either integrated, planned for a future release or not yet planned to implement for a specific version.
Past Releases
The features listed here are integrated in the product, so they are available for download.
Future Releases
The features listed here are planned for one of the upcoming releases.
Not yet planned Features
These features are not planned for a specific release yet. They are candidates for being part of future releases. For a better overview, the features are grouped by category.
- Chart-Types
- Legend
- Data Labels
- Axis
- Chart formatting
- Trend lines and error bars
- Range and data series
- Chart annotation
- Miscellaneous
This list is based primarily on the List of wished enhancements for Charts.
Technical Articles
Here you can find some technical articles about the chart, that may help for future development.
- There still some architectural issues left that have to be solved. (article by Björn Milcke)
- Why not implement everything in OOo (article by Leonard Mada)
People
- working permanently on the code
- Björn Milcke (Sun Microsystems)
- Ingrid Halama (Sun Microsystems)
- code contributors
- Daniel Rentz (Sun Microsystems, Calc)
- Niklas Nebel (Sun Microsystems, Calc)
- Thomas Lange (Sun Microsystems, Writer)
- Regina Henschel (splines, online-help, testing)
- Li Yuan (Redflag CH2000)
- Weiz Hao (Redflag CH2000)
- Mao Yonggang (Redflag CH2000)
- working permanently on chart QA
- Thomas Klarhöfer (Sun Microsystems, QA for chart)
- Jörg Sievers (Sun Microsystems, Test-tool automation for chart)
- User Experience
- Matthias Müller-Prove (Sun Microsystems)
- Documentation
- Uwe Fischer (Sun Microsystems)
- other contributors
- Tony Galmiche (feature document, Wiki, testing)
- Pierre-André Galmes (StarXpert, testing, Wiki)
- Jörg Wartenberg (specification)
- Leonard Mada (Wiki)
Note: if anybody thinks he is missing on this list or a comment is not complete, please drop me a note or modify this page
Some useful information
- Chart Project Page: http://graphics.openoffice.org/chart/chart.html
- Chart Specifications: http://specs.openoffice.org/chart/index.html
- IRC channel: #chart2.openoffice.org on freenode
- Chart-related Entries on OOo Sun Developers Weblog: GullFOSS