Difference between revisions of "Documentation/OOo3 User Guides/Calc Guide/Results 2"
(Corrected license info) |
(→Sorting of the results) |
||
| Line 5: | Line 5: | ||
|NextPage=Documentation/OOo3_User_Guides/Calc Guide/Multiple data fields | |NextPage=Documentation/OOo3_User_Guides/Calc Guide/Multiple data fields | ||
}}__notoc__ | }}__notoc__ | ||
| − | == Sorting | + | == Sorting the result == |
| − | The result of any DataPilot is sorted (categories) in columns and rows in an | + | The result of any DataPilot is sorted (categories) in columns and rows in an ascending order. You can change the sorting in two ways: |
* Sort manually by using drag and drop. | * Sort manually by using drag and drop. | ||
| − | * Sort automatically | + | * Sort automatically by choosing the options in the preferences dialog of the row or column field. |
=== Sort manually by using drag and drop === | === Sort manually by using drag and drop === | ||
| − | + | You can change the order within the categories by moving the cells with the category values in the result table of the DataPilot. | |
Please be aware that in Calc a cell has to be selected. It is not enough that this cell contains the cell cursor. The background of a selected cell is marked with a different colour. To achieve this, click in one cell with no extra key pressed and redo this by pressing additionally the ''Shift'' or ''Ctrl'' key. Another possibility is to keep the mouse button pressed on the cell you want to select, move the mouse to a neighbor cell and move back to your original cell before you release the mouse button. | Please be aware that in Calc a cell has to be selected. It is not enough that this cell contains the cell cursor. The background of a selected cell is marked with a different colour. To achieve this, click in one cell with no extra key pressed and redo this by pressing additionally the ''Shift'' or ''Ctrl'' key. Another possibility is to keep the mouse button pressed on the cell you want to select, move the mouse to a neighbor cell and move back to your original cell before you release the mouse button. | ||
| − | === | + | === Sort automatically === |
| − | To | + | #To sort automatically, start the preference options of the row or column field by right-clicking on the table area with the DataPilot result. |
| + | #Select '''Start''' to open the DataPilot. | ||
| + | #Within the Layout area of the DataPilot, double-click the field you want to sort. | ||
| + | #In the Data Field dialog, click '''Options''' to display the Data Field Options dialog. | ||
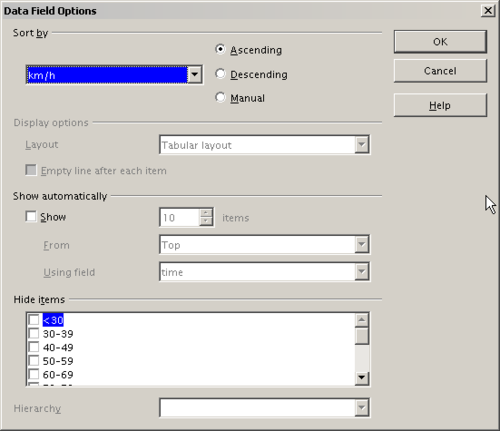
[[Image:CG3Ch6F50.png|thumb|none|500px|''Options for a row or column field'']] | [[Image:CG3Ch6F50.png|thumb|none|500px|''Options for a row or column field'']] | ||
| − | For ''Sort by'' | + | For ''Sort by'' select how to display the information, either ''Ascending ''or ''Descending''. On the left side is a drop-down list where you can select the field this setting should apply to. With this method you can specify that sorting does not happen according to the categories but according to the results of the data field. |
== Drill (show details) == | == Drill (show details) == | ||
Revision as of 21:19, 27 December 2010
Sorting the result
The result of any DataPilot is sorted (categories) in columns and rows in an ascending order. You can change the sorting in two ways:
- Sort manually by using drag and drop.
- Sort automatically by choosing the options in the preferences dialog of the row or column field.
Sort manually by using drag and drop
You can change the order within the categories by moving the cells with the category values in the result table of the DataPilot.
Please be aware that in Calc a cell has to be selected. It is not enough that this cell contains the cell cursor. The background of a selected cell is marked with a different colour. To achieve this, click in one cell with no extra key pressed and redo this by pressing additionally the Shift or Ctrl key. Another possibility is to keep the mouse button pressed on the cell you want to select, move the mouse to a neighbor cell and move back to your original cell before you release the mouse button.
Sort automatically
- To sort automatically, start the preference options of the row or column field by right-clicking on the table area with the DataPilot result.
- Select Start to open the DataPilot.
- Within the Layout area of the DataPilot, double-click the field you want to sort.
- In the Data Field dialog, click Options to display the Data Field Options dialog.
For Sort by select how to display the information, either Ascending or Descending. On the left side is a drop-down list where you can select the field this setting should apply to. With this method you can specify that sorting does not happen according to the categories but according to the results of the data field.
Drill (show details)
With a drill you can show for the single, compressed values in the DataPilot result the related detailed data. You can activate a drill through a double-click on the cell or use Data > Group and Outline > Show Details. You have to distinguish two cases:
- The active cell is the category of a row or column field.
In this case drill means an additional breakdown into the categories of another field.
For example, double-click on the cell with the value golfing in the row field region. In this case the values that are aggregated in the category golfing are subdivided according to another field.
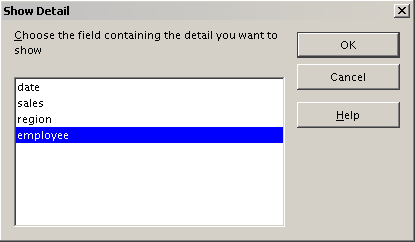
Since there are more possibilities for a subdivision, a dialog appears where you can make your needed settings. - The active cell is a value of the data field.
In this case drilldown means a listing of all data entries of the data source that aggregates to this value.
Double-click on the cell with the value $18,741 and you'll get a list of all data sets that are included in this value. This list is shown in an new sheet.
To hide the details again, double-click on the cell golfing or choose Data > Group and Outline > Hide Details.
The DataPilot remembers your selection (in our example the field employee), so that for the next drill down for a category in the field region the dialog does not appear. To remove the selection employee, open the DataPilot dialog by right-clicking and choosing Start, then delete the unwanted selection in the row or column field.
Filtering
For limiting the analysis with the DataPilot to a subset of the information that is contained in the data basis, you can filter with the DataPilot.
To use the filtering function that is implemented in the DataPilot, just click on the field Filter on the left side above the results.
In the Filter dialog, you can define up to three filter options that are used in the same way as Calc’s default filter.
Updating (refreshing) changed values
After you have created the DataPilot, changes in the source data do not cause an automatic update in the resulting table. You have to always update (refresh) the DataPilot manually.
Changes in the source data could appear in two ways:
- The content of existing data sets has been changed. For example, you might have changed a sales value afterwards. To update the DataPilot, right-click in the result area and choose Refresh (or choose Data > DataPilot > Refresh from the menu bar).
- You have added or deleted data sets in the original list. In this case the change means that the DataPilot has to use a different area of the spreadsheet for its analysis. A change for the data reference for an existing DataPilot is not possible. In this case you have to redo the DataPilot.
Cell formatting
The cells in the results area of the DataPilot are automatically formatted with a simple format by Calc. You can use all the formatting options that are available for Calc if you wish them to have a different appearance. However, every change in the design of the DataPilot and each update changes your formatting back to the simple default formatting.
For the number format in the data field, Calc uses the number format that is used in the corresponding cell in the source list. In most cases, this is useful. For example, if the values are in the currency format, then the corresponding cell in the result area is also formatted as currency. The DataPilot does not recognize that this might be useless, if the result is a fraction or a percentage because of the options used. Such results have to be without a unit or have to be displayed as a percentage. You can correct the number format manually, but the correction stays only until the next update.
| Content on this page is licensed under the Creative Common Attribution-Share Alike 3.0 license (CC-BY-SA). |


