Windows Debugging
This is Windows-specific debugging information. There are also generic notes on Debugging.
General notes
You want to debug soffice.bin, as soffice.exe loads that in a separate process. You can copy soffice.bin to sofficebin.exe if it has to be called ".exe" for your debugger.
Debugging with Debugging Tools for Windows
Debugging tools for Windows provide a low lever debugger well suited for production and source debugging. If you need to debug an optimized version, or you want low level access, this is the right tool.
Build the modules that you are interested in source level debugging with debug info:
build.pl debug=true
build.pl --deliver
and copy the new DLLs to your OpenOffice.org installation
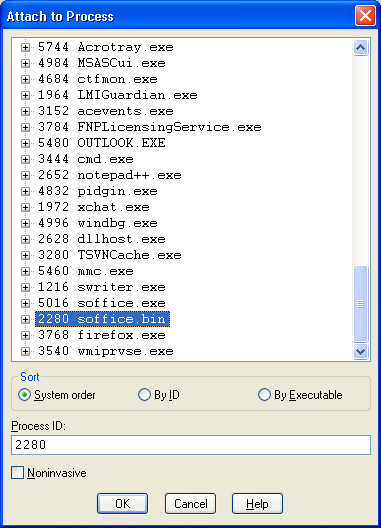
Then start Windbg: Debugging Tools for Windows -> Windbg. Then attach to the soffice.bin process:
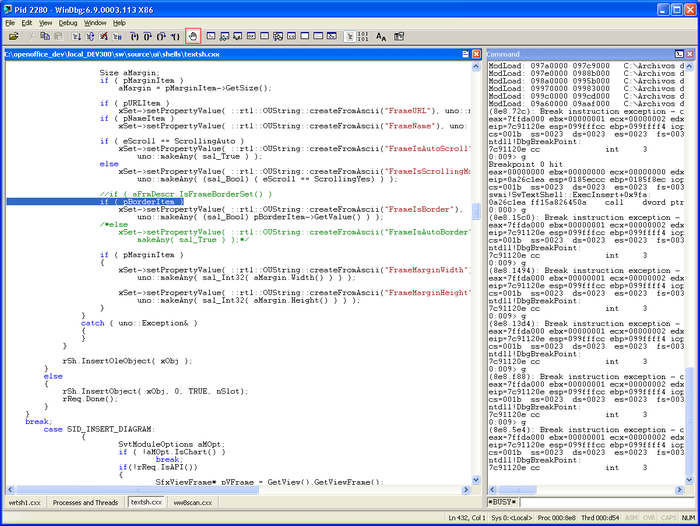
In order to place breakpoints, you should load the source file with File->Open Source File, and then either F9 or either clicking in the hand toolbar icon.
Unfortunately there is no feedback in the source view about the breakpoint. One can see breakpoints typing bl in the command window.
The you run commands in Openoffice until the breakpoint is hit. Then you can see the program state and control its execution.
Windbg is a very powerful debugger. It is oriented to low level debugging, but as we have just seen it is also posible to do source level debugging. Take your time to read its online help.
Debugging with Visual Studio
Debugging a non-debug exe
Problems tend to raise exceptions, you want to catch them before the exception happens. Run sofficebin.exe in the debugger and look at the Output window. Exceptions look like this:
First-chance exception at 0x7c81eb33 in sofficebin.exe: Microsoft C++ exception: com::sun::star::uno::RuntimeException @ 0x00e1e690.
0x7c81eb33 is the address of the instruction following the call to raise the exception. Go to this address in the disassembler, find the instruction before (which will be a call instruction), and set a break point there.
Then when an exception occurs, you can see in the call stack where it is coming from.
Visualizers for STL containers
See VisualStudioVisualizer for examples how to "visualize" the contents of STL containers and iterators in the Visual Studio debugger.
Debugging with gdb
This is currently not working. Trying to debug soffice.bin ends up with a segmentation fault. Any suggestions appreciated!
Stderr and stdout
Using normal command-line in Windows, you cannot see the standard out or standard error. The trick is to start OOo (soffice.exe) from cygwin. You can easily pipe stderr (soffice.exe 2> log.txt) or stdout (soffice.exe >log.txt) to a file.

