Uploads by Drking
From Apache OpenOffice Wiki
This special page shows all uploaded files.
| Date | Name | Thumbnail | Size | Description | Versions |
|---|---|---|---|---|---|
| 07:49, 28 September 2008 | Calc chidist equation.png (file) |  |
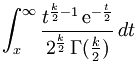
2 KB | 2 | |
| 07:18, 27 September 2008 | Calc gammadist1 equation.png (file) |  |
1 KB | 2 | |
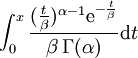
| 07:16, 27 September 2008 | Calc gammadist0 equation.png (file) |  |
990 bytes | Reverted to version as of 07:11, 27 September 2008 | 4 |
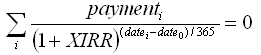
| 18:19, 7 September 2008 | Calc xirr equation.png (file) | 3 KB | Equation which XIRR function solves | 1 | |
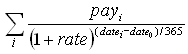
| 21:30, 30 July 2008 | Calc xnpv equation.png (file) |  |
1 KB | Calc: equation for XNPV function | 1 |
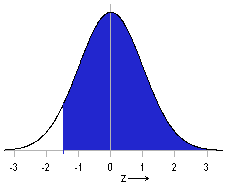
| 08:31, 20 July 2008 | Calc ztest graph2.png (file) |  |
2 KB | Calc: ZTEST function illustrative graph 2 | 1 |
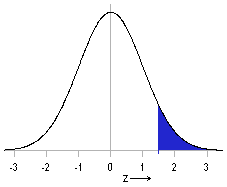
| 08:31, 20 July 2008 | Calc ztest graph1.png (file) |  |
2 KB | Calc: ZTEST function illustrative graph 1 | 1 |
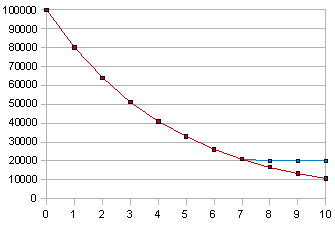
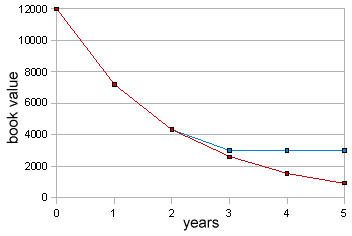
| 17:55, 14 July 2008 | Calc vdb graph2.png (file) |  |
3 KB | Calc: VDB function - graph illustrating examples | 1 |
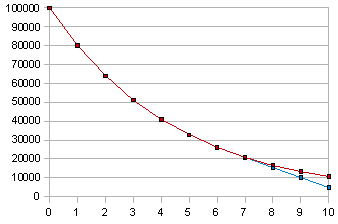
| 17:54, 14 July 2008 | Calc vdb graph1.png (file) |  |
3 KB | Calc: VDB function - graph illustrating examples | 1 |
| 17:42, 14 July 2008 | Calc ddb graph1.png (file) |  |
4 KB | Calc: DDB function - graph to illustrate examples | 1 |
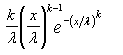
| 18:02, 18 June 2008 | Calc weibull1 equation.png (file) |  |
700 bytes | Calc: equation for WEIBULL function, mode 1 | 1 |
| 18:02, 18 June 2008 | Calc weibull0 equation.png (file) |  |
493 bytes | Calc: equation for WEIBULL function, mode 0 | 1 |
| 07:56, 15 June 2008 | Calc z formula.png (file) |  |
432 bytes | Calc: formula for the z statistic used in ZTEST | 1 |
| 16:52, 13 June 2008 | Calc tdist equation.png (file) |  |
2 KB | 2 | |
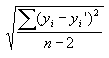
| 17:38, 12 June 2008 | Calc steyx equation.png (file) |  |
678 bytes | Calc: equation for STEYX function | 1 |
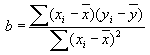
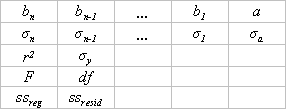
| 17:38, 12 June 2008 | Calc linregress b.png (file) |  |
825 bytes | Calc: equation for linear regression parameter b | 1 |
| 17:37, 12 June 2008 | Calc linregress a.png (file) |  |
341 bytes | Calc: equation for linear regression parameter a | 1 |
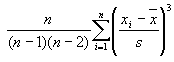
| 03:09, 11 June 2008 | Calc skew equation.png (file) |  |
885 bytes | Calc: equation for SKEW function | 1 |
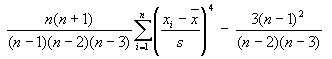
| 03:08, 11 June 2008 | Calc kurt equation.png (file) | 1 KB | Calc: equation for KURT function | 1 | |
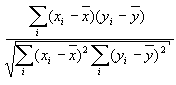
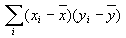
| 18:00, 10 June 2008 | Calc pearson equation.png (file) |  |
1 KB | Calc: equation for PEARSON function | 2 |
| 17:57, 10 June 2008 | Calc xymean.png (file) |  |
271 bytes | Calc: x-bar, y-bar symbols | 1 |
| 17:55, 10 June 2008 | Calc covar equation.png (file) |  |
571 bytes | Calc: equation for COVAR function | 1 |
| 18:02, 19 May 2008 | Calc poisson1 equation.png (file) |  |
990 bytes | Calc: POISSON function equation, mode 1 | 1 |
| 18:01, 19 May 2008 | Calc poisson0 equation.png (file) |  |
603 bytes | Calc: POISSON function equation, mode 0 | 1 |
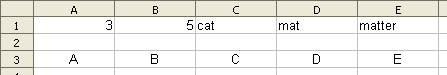
| 22:01, 12 May 2008 | Calc lookup example.png (file) | 1 KB | Calc: example for LOOKUP function | 2 | |
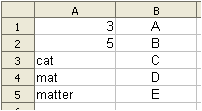
| 18:09, 4 May 2008 | Calc vlookup example.png (file) |  |
1 KB | Calc: VLOOKUP example | 1 |
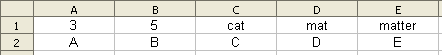
| 04:31, 4 May 2008 | Calc hlookup example.png (file) | 1 KB | Calc: example for HLOOKUP function | 1 | |
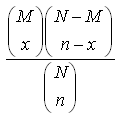
| 20:36, 30 April 2008 | Calc hypgeomdist equation2.png (file) |  |
1 KB | Calc: equation 2 for the HYPGEOMDIST function | 1 |
| 20:36, 30 April 2008 | Calc hypgeomdist equation1.png (file) | 1 KB | Calc: equation 1 for the HYPGEOMDIST function | 1 | |
| 18:18, 30 April 2008 | Calc fisherinv equation.png (file) |  |
449 bytes | Calc: equation for the FISHERINV function | 1 |
| 17:57, 30 April 2008 | Calc fisher equation.png (file) |  |
1,015 bytes | Calc: equation for the FISHER function | 2 |
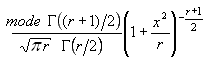
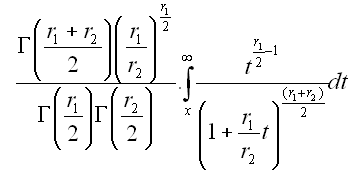
| 17:24, 30 April 2008 | Calc fdist equation.png (file) |  |
4 KB | Calc: equation for FDIST | 1 |
| 17:24, 30 April 2008 | Calc expondist1 equation.png (file) |  |
335 bytes | Calc: equation for EXPONDIST, mode 1 | 1 |
| 17:23, 30 April 2008 | Calc expondist0 equation.png (file) |  |
429 bytes | Calc: equation for EXPONDIST, mode 0 | 1 |
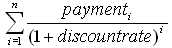
| 05:36, 29 April 2008 | Calc npv equation.png (file) |  |
1 KB | Calc: equation for NPV function | 1 |
| 05:56, 27 April 2008 | Calc devsq equation.png (file) |  |
939 bytes | Calc: equation for DEVSQ function | 2 |
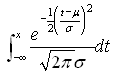
| 18:34, 26 April 2008 | Calc normdist1 equation.png (file) |  |
1 KB | Calc: NORMDIST equation, mode 1 | 1 |
| 18:34, 26 April 2008 | Calc normdist0 equation.png (file) |  |
952 bytes | Calc: NORMDIST equation, mode 0 | 1 |
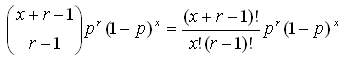
| 15:34, 26 April 2008 | Calc negbinomdist equation.png (file) | 2 KB | Calc: NEGBINDIST equation | 1 | |
| 05:03, 26 April 2008 | Calc b equation.png (file) |  |
2 KB | Equation used by Calc B function | 1 |
| 17:20, 17 April 2008 | Calc harmean formula.png (file) |  |
808 bytes | Calc: formula for HARMEAN function | 1 |
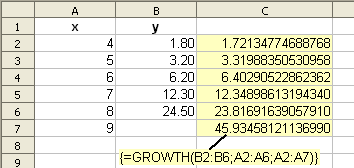
| 05:31, 17 April 2008 | Calc growth example.png (file) |  |
4 KB | Calc: example use of GROWTH function | 1 |
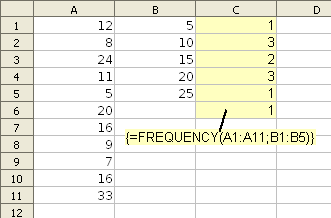
| 21:38, 16 April 2008 | Calc frequency example.png (file) |  |
4 KB | Calc: exaple use of FREQUENCY function | 1 |
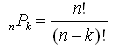
| 05:30, 8 April 2008 | Calc permut formula.png (file) |  |
858 bytes | Calc PERMUT function: formula used | 1 |
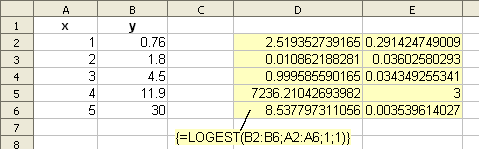
| 06:36, 3 April 2008 | Calc logest example.png (file) |  |
4 KB | Calc: Example for LOGEST function description | 1 |
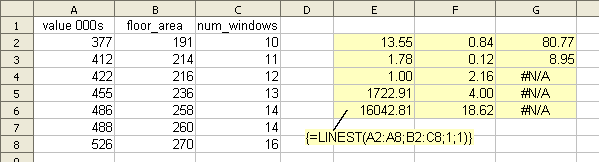
| 06:16, 27 March 2008 | Calc linest example2.png (file) | 4 KB | Calc LINEST function - example with multiple x values | 1 | |
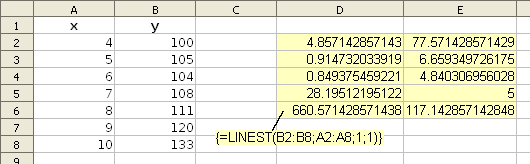
| 07:18, 26 March 2008 | Calc linest example.png (file) |  |
5 KB | Calc LINEST function example | 1 |
| 06:51, 26 March 2008 | Calc linest output.png (file) |  |
1 KB | what the LINEST function returns | 1 |
| 13:46, 21 March 2008 | Calc array4.png (file) |  |
415 bytes | Calc - inline array | 2 |
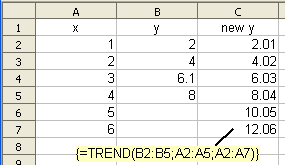
| 13:15, 21 March 2008 | Calc trend example.png (file) |  |
2 KB | Calc: Example used in TREND function description | 1 |