Difference between revisions of "Documentation/OOo3 User Guides/Writer Guide/Adding captions"
Clairedwood (Talk | contribs) m (→Use a table) |
Clairedwood (Talk | contribs) (→Use a table) |
||
| Line 73: | Line 73: | ||
=== Use a table === | === Use a table === | ||
Create a one-column, two-row table. Place the picture in one row and type the caption in the other row—or use two or more rows for the caption and other text. This method can be especially useful for pictures with numbered legends, such as the [[Documentation/OOo3_User_Guides/Writer_Guide/Positioning_graphics| Objects Toolbar]] in this chapter | Create a one-column, two-row table. Place the picture in one row and type the caption in the other row—or use two or more rows for the caption and other text. This method can be especially useful for pictures with numbered legends, such as the [[Documentation/OOo3_User_Guides/Writer_Guide/Positioning_graphics| Objects Toolbar]] in this chapter | ||
| + | |||
| + | ==Creating an Image Map== | ||
| + | |||
| + | An image map defines areas of an image (called hotspots) with hyperlinks to web addresses, other files on the computer, or parts of the same document. Hotspots are the graphic equivalent of text hyperlinks (described in Chapter 12). Clicking on a hotspot causes OOo to open the linked page in the appropriate program (for example, the default browser for an HTML page; OOo Calc for a .ODS file; a PDF viewer for a PDF file). You can create hotspots of various shapes and include several hotspots in the same image. | ||
| + | |||
| + | To use the image map editor: | ||
| + | |||
| + | # In your OOo document, select the picture where you want to define the hotspots. | ||
| + | # Choose '''Edit > ImageMap''' from the menu bar. The ImageMap Editor opens. | ||
| + | # Use the tools and fields in the dialog to define the hotspots and links necessary. | ||
| + | # Click the Apply icon to apply the settings. | ||
| + | # When done, click the '''Save''' icon to save the imagemap to a file, then click the '''X''' in the upper right corner to close the dialog. | ||
| + | |||
| + | The main part of the dialog shows the image on which the hotspots are defined. A hotspot is identified by a line indicating its shape. | ||
| + | |||
| + | The toolbar at the top of the dialog contains the following tools: | ||
| + | |||
| + | * Apply button: click this button to apply the changes. | ||
| + | * Load, Save, and Select icons. | ||
| + | * Tools for drawing a hotspot shape: these tools work in exactly the same way as the corresponding tools in the Drawing toolbar. | ||
| + | * Edit, Move, Insert, Delete Points: advanced editing tools to manipulate the shape of a polygon hotspot. Select the Edit Points | ||
| + | tool to activate the other tools. | ||
| + | * Active icon: toggles the status of a selected hotspot between active and inactive. | ||
| + | * Macro: associates a macro with the hotspot instead of just associating an hyperlink. | ||
| + | * Properties: sets the hyperlink properties and adds the Name attribute to the hyperlink. | ||
| + | |||
| + | Below the toolbar, specify for the selected hotspot: | ||
| + | * Address: the address pointed by the hyperlink. You can also point to an anchor in a document; to do this, write the address in this format: <fonttype:courier>file:///<path>/document_name#anchor_name</fonttype> | ||
| + | |||
| + | |||
| + | |||
| + | |||
| + | |||
| + | |||
| + | |||
| + | |||
{{CCBY}} | {{CCBY}} | ||
[[Category: Writer Guide (Documentation)]] | [[Category: Writer Guide (Documentation)]] | ||
Revision as of 13:39, 30 May 2010
- Adding images to a document
- Modifying an image
- Cropping, resizing, rotating, and other settings
- Using Writer's drawing tools
- Positioning graphics within the text
- Arranging, anchoring, and aligning
- Wrapping text around graphics
- Examples of wrapping
- Adding captions to graphics
- Adding an image to the Gallery
- Graphic file types supported
You can add captions to graphics in three ways: automatically, by using the Caption dialog box, or manually.
Adding captions automatically
You can set up OOo to add captions automatically whenever you insert a graphic, a table, or other objects into a document. You can choose which objects are captioned automatically, what the sequence name is for each caption (for example, “Table” or “Illustration”), and the position of the caption.
To set up automatic captions:
- Click Tools > Options. On the Options dialog box, click on the + sign next to OpenOffice.org Writer to show a list of options.
- Select AutoCaption. Now you can see several choices at the right of the dialog box for adding captions automatically.
- Choose which objects you want to be automatically captioned and specify the characteristics of the captions.
For more information, see “AutoCaption options” in Chapter 2 (Setting up Writer).
When you insert a graphic, if automatic captioning is enabled, the graphic is placed in a frame along with a caption containing the default sequence name for graphics―Illustration. Position the cursor in the caption area and type the text for the caption. You can change the sequence name by selecting one from the drop-down Category list.
Using the Caption dialog box
To add captions using the Caption dialog box:
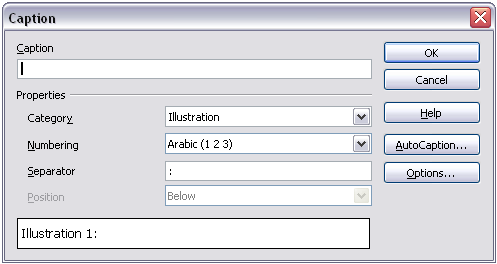
- Insert the graphic, then select it and click Insert > Caption.
- Under Properties on the Caption dialog box, make your selections for the Category, Numbering, and Separator fields (Illustration, Arabic (1 2 3), and a colon (:), respectively, for the example below and type your caption text in the Caption text box at the top. Whatever text you enter for the caption appears in the box at the bottom, after the sequence name, number, and separator.
- Click OK. The graphic and its caption are placed in a frame.
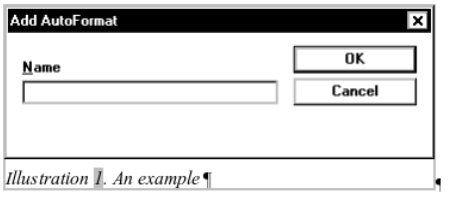
An example of a graphic and its caption contained in a frame. The outer box shows the edge of the frame; this border is normally set to be invisible.
Overriding the default positioning of captions
The default positioning for picture captions is Below, and that position cannot be changed using the Caption dialog. However, you can override the positioning manually, as follows:
- Follow the instructions in Using the Caption dialog box to create the caption.
- Right-click on the picture (not the frame surrounding picture and caption) and make sure that Anchor > To paragraph is selected.
- Left-click on the picture and drag it below the caption.
Adding captions manually
If you need to save as .DOC files or export in other formats, you may find that captions applied as described above (either automatically or using the Caption dialog box) are lost during the export. To avoid export problems, or as another way to put captions above pictures or below them (the usual case), you can add a caption manually, in either of two ways:
- Place the graphic and its caption in separate paragraphs.
- Use a table.
Place the graphic and its caption in separate paragraphs
Insert the graphic and anchor it to its paragraph as a character. Press Enter to create a new paragraph for the caption.
- In the caption paragraph, type, for example, Figure and add a space.
- To insert the figure number automatically, click Insert > Fields > Other (Control + F2) and select the Variables tab.
- Select Number range in the Type list. Select Figure in the Selection list and choose, for example, Arabic (1 2 3) in the Format drop-down list. Click the Insert button.
- A number will appear after the word “Figure” in the caption. Now, type the text of the caption.
Use a table
Create a one-column, two-row table. Place the picture in one row and type the caption in the other row—or use two or more rows for the caption and other text. This method can be especially useful for pictures with numbered legends, such as the Objects Toolbar in this chapter
Creating an Image Map
An image map defines areas of an image (called hotspots) with hyperlinks to web addresses, other files on the computer, or parts of the same document. Hotspots are the graphic equivalent of text hyperlinks (described in Chapter 12). Clicking on a hotspot causes OOo to open the linked page in the appropriate program (for example, the default browser for an HTML page; OOo Calc for a .ODS file; a PDF viewer for a PDF file). You can create hotspots of various shapes and include several hotspots in the same image.
To use the image map editor:
- In your OOo document, select the picture where you want to define the hotspots.
- Choose Edit > ImageMap from the menu bar. The ImageMap Editor opens.
- Use the tools and fields in the dialog to define the hotspots and links necessary.
- Click the Apply icon to apply the settings.
- When done, click the Save icon to save the imagemap to a file, then click the X in the upper right corner to close the dialog.
The main part of the dialog shows the image on which the hotspots are defined. A hotspot is identified by a line indicating its shape.
The toolbar at the top of the dialog contains the following tools:
- Apply button: click this button to apply the changes.
- Load, Save, and Select icons.
- Tools for drawing a hotspot shape: these tools work in exactly the same way as the corresponding tools in the Drawing toolbar.
- Edit, Move, Insert, Delete Points: advanced editing tools to manipulate the shape of a polygon hotspot. Select the Edit Points
tool to activate the other tools.
- Active icon: toggles the status of a selected hotspot between active and inactive.
- Macro: associates a macro with the hotspot instead of just associating an hyperlink.
- Properties: sets the hyperlink properties and adds the Name attribute to the hyperlink.
Below the toolbar, specify for the selected hotspot:
- Address: the address pointed by the hyperlink. You can also point to an anchor in a document; to do this, write the address in this format: <fonttype:courier>file:///<path>/document_name#anchor_name</fonttype>
| Content on this page is licensed under the Creative Common Attribution 3.0 license (CC-BY). |

