Borders, backgrounds, and boundaries
- Creating a table
- Formatting the table layout
- Resizing and positioning the table
- Resizing, positioning, and inserting rows and columns
- Merging and splitting cells
- Borders, backgrounds, and boundaries
- Formatting the table text
- Data entry and manipulation in tables
- Additional table operations
- Table menu and toolbar
表格邊框
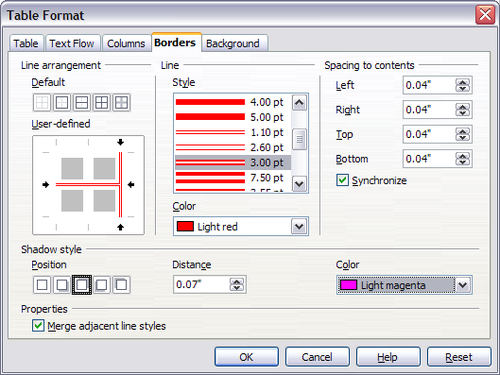
在表格格式對話框,選擇邊框選項(圖6)。
在這裡您可以設定整個表或數個儲存格的邊框。 此外,也可為整張表加入陰影。
邊框由三個部分組成:線條的排序,線條的類型,至內文的距離
- 在指定的邊界線條的排序。如果選定一組的儲存格的邊套用於這些格式。您可以在外邊框選定的儲存格指定邊框的風格。OOo的提供5種排序方法,但你可以在自訂的範圍很輕鬆地按一下並得到正是您想要的樣子。當您選定多組的儲存格的邊套用於這些格式時,請點選在十字線條排序,可以同時修改多個邊界(圖中所示,儲存格右邊框正在進行修改)
- 線條類型:樣式和顏色。有多個不同樣式和顏色可供選擇。
- 至內文的距離:距離可以指定左,右,上面和下面。同步化則是輸入新的間隔時,所有的四個邊框都會套用相同的 [至內容的間隔] 設定的。
- 陰影的樣式是適用於整個表格,陰影由三個部分組成:位置,間隔,以及它的顏色。.
- 如果選定合併相鄰行樣式,將 Writer 表格中相鄰儲存格的兩種不同邊框樣式合併為一種邊框樣式。此特性對 Writer 文件中的整份表格都有效。.
選擇背景的顏色與圖形
一個表的背景可以提升資料的可讀性,可以突顯出表格中最重要的部分(如標題或特定的儲存格),或者使表格更具吸引力。您可以選擇兩種類型的背景:純色或圖形。背景可以應用到整個表,一個儲存格,或一行。
當你想建立背景顏色或圖形當作表格的標題,這是非常快速的選擇,該表在本指南中採用這種技術.
儲存格,行或表設定背景:
- 將指標放置在儲存格內、行、表格或你想工作的任何地方,如果您想應用多個儲存格的背景,選擇多個儲存格.
- 點選滑鼠右鍵,從彈出的選單中選擇表格 ,或從主選單選擇表>“表格屬性。.
- 在表格對話框,選擇背景標籤。.
- 在設定時,選擇是否應用在設定的儲存格,行或表。.
- 如果您選擇儲存格 ,變化只適用於選定的儲存格或指標所在的儲存格。即使設定多個儲存格的背景也會套用到每個儲存格.
- 如果您選擇行 ,指標所在的地方會影響整行改變。.
- 如果您選擇表 ,不管指標位置或選定的儲存格,變更背景則影響整個表。.
- In the As section, choose whether the background is a color or a graphic.
- First select the graphic from your computer's file system with the Browse button. (Writer supports a large number of graphics formats.)
- You can use the Link option to link the graphic file. If it is linked, changes to the graphic (for example, if you edit it in a different software package) are reflected in your document. However, you also need to keep the linked graphic file with the document file. If, for example, you email the document without the graphic file, the graphic will no longer be visible.
- Under Type, select the type of placement for the graphic.
- If you choose Position, you can select in the position map where the graphic will be displayed in the selected area.
- If you choose Area, the graphic is stretched to fill the whole area.
- If Tile, the graphic is tiled (repeated horizontally and vertically) to fill the area.
- If the Preview option is checked, the graphic displays in the pane on the right.
- To apply the graphic, click OK.
To apply a color, select the color and click OK. Remember that you can add custom colors by choosing Tools > Options > Colors.
To apply a graphic:
The figure below shows an example of a table set with a background image, and the first row background colored. As you can see, the row background covers the table background.
Displaying or hiding table boundaries
A table boundary is a set of pale (usually gray) lines around the cells when viewed on‑screen in OOo. These boundaries are not printed; their only function is to help you see where the table cells are.
To display the table the same way on the screen as on the printed page, with no boundary lines, right-click on the table and select Table Boundaries from the pop-up menu. Repeat this to have the boundaries appear again.
| Content on this page is licensed under the Creative Common Attribution 3.0 license (CC-BY). |


