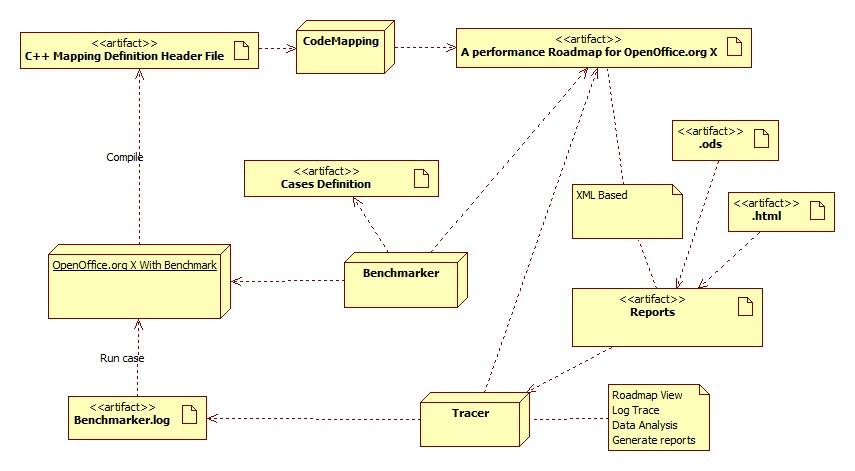
Performance Benchmark Tool Set
Goals
- To measure performance OOo, and show interaction of all hotspots.
- To trace chance of OOo performance.
- To collect and describe performance test-cases and problems in OOo.
We define the XML Based Performance Roadmap, all tools dependency the Performance Roadmap.
A sample of Performance Roadmap
<PerformanceRoadmap>
<Module name="writer">
<Desc>This measures all about OpenOffice.org writer's performance. All writer document types must be tested.</Desc>
<View name="load">
<Desc>Load documents, not consider loading from startup, start Moduleor script marco.</Desc>
<Action name="loadfilter">
<Desc>Find the suitable filter to handle the document.</Desc>
</Action>
<Action name="xmlload">
<Desc>XML document parsing and form a doc object.</Desc>
<Action name="meta">
<Desc>Meta.xml parsing.</Desc>
</Action>
<Action name="settings">
<Desc>Settings.xml parsing.</Desc>
</Action>
<Action name="styles">
<Desc>Styles.xml parsing.</Desc>
</Action>
<Action name="content">
<Desc>Content.xml parsing.</Desc>
</Action>
</Action>
<Action name="frame">
<Action name="createframe">
<Desc>Create a new frame.</Desc>
</Action>
<Action name="findframe">
<Desc>Find an exsisted frame.</Desc>
</Action>
</Action>
<Action name="font">
<Desc>Get all system supported fonts.</Desc>
</Action>
<Action name="menu">
<Desc>Create default and user defined menu.</Desc>
</Action>
<Action name="toolbar">
<Desc>Create default and user defined toolbars.</Desc>
</Action>
<Action name="layout">
<Desc>Layout all visual elements.</Desc>
<Action name="layoutmenutoolbar">
<Desc>Layout menus and toolbars.</Desc>
</Action>
<Action name="layoutdoc">
<Desc>Layout document contents.</Desc>
</Action>
</Action>
</View>
<View name="save">
…
</View>
</Module>
</PerformanceRoadmap>
Several result will be generated by Performance Tools.
Log file
For reducing time taken by benchmark code, we record time and case identification with number, that means the log file will be in a binary format.
There are two section in log file, the “Test Information” and “Benchmark Data”.
The “Test Information” is the record of current test, include version of OOo, version of OOo roadmap, the date of running test, and hardware information. The “Test Information” will generated by Benchmarker (an external tool).
The “Benchmark Data” is recorded by native code in soffice. And there are two kinds of data will be putted in to log.
One is the simple time record of trace point, the other is the memory or object data.
A simple time trace record structure like:
struct BenchmarkRecord
{
unsigned int mCaseId;
unsigned int mNodeNo;
unsigned __int64 mTick;
};
Memory and Object data tracing are supported by a series of MACRO like:
TRACE_PUSH_MEMORY(*pAddr, size)
TRACE_PUSH_OBJECT(*pObj, ObjType)
...
These function push a block of memory into log directly.
Mapping Code
To map node definition of performance roadmap to native code like following sample, we need a tool named “CodeMapping” to transform roadmap into number definition.
A result from CodeMapping.
benchmarkmap.h
#ifndef _PERFORMANCE_ROADMAP_
#define _PERFORMANCE_ROADMAP_
#define CASE_LOAD 1
#define CASE_LOAD_START 0
#define CASE_LOAD_LOADFILTER 1 //Find the suitable filter to handle the document.
#define CASE_LOAD_XMLLOAD 2 //XML document parsing and form a doc object.
#define CASE_LOAD_META 4
#define CASE_LOAD_SETTINGS 5
#define CASE_LOAD_STYLES 6
#define CASE_LOAD_CONTENT 7
#define CASE_LOAD_FRAME 8
#define CASE_LOAD_CREATEFRAME 9
#define CASE_LOAD_FINDFRAME 10
#define CASE_LOAD_FONT 11
#define CASE_LOAD_MENU 12
#define CASE_LOAD_TOOLBAR 13
#define CASE_LOAD_LAYOUT 14
#define CASE_LOAD_LAYOUTMENUTOOLBAR 15
#define CASE_LOAD_LAYOUTDOC 16
#define CASE_LOAD_END 0xFFFF
#define CASE_SAVE 1
#define CASE_SAVE_START 0
//...
#define CASE_SAVE_END 0xFFFF
#endif //_PERFORMANCE_ROADMAP_
Reports
For getting readable report, a tool named Tracer will load a set of benchmarker log files, and fetch records of specified cases choosed with GUI application or web page. And export multi-format reports.
CodeMapping: To transform the performance roadmap into native language(C++/C) for getting numerical case-id and node-id definition header files. of performance test case in roadmap.
Benchmarker: To run standard cases defined in performance roadmap or user defined cases, and generate benchmark log(eg. Benchmarker.log in above chart).
Tracer: To view benchmark log and interaction of OOo's hotspots in roadmap and to export report in multi-format (like .ods, .html, ...)
Web Supporting
[[Image:]]
