Difference between revisions of "Performance Benchmark Tool Set"
m |
|||
| (4 intermediate revisions by one other user not shown) | |||
| Line 8: | Line 8: | ||
== Benchmark Tool Set == | == Benchmark Tool Set == | ||
| − | + | For getting readable report, a tool named Tracer will load a set of benchmarker log files, and fetch records of specified cases choosed with GUI application or web page. And export multi-format reports. | |
| + | |||
| + | [[Image:Perf bm toolset.jpg]] | ||
'''CodeMapping: '''To transform the performance roadmap into native language(C++/C) for getting numerical case-id and node-id definition header files. of performance test case in roadmap. | '''CodeMapping: '''To transform the performance roadmap into native language(C++/C) for getting numerical case-id and node-id definition header files. of performance test case in roadmap. | ||
| Line 14: | Line 16: | ||
'''Benchmarker''': To run standard cases defined in performance roadmap or user defined cases, and generate benchmark log(eg. Benchmarker.log in above chart). | '''Benchmarker''': To run standard cases defined in performance roadmap or user defined cases, and generate benchmark log(eg. Benchmarker.log in above chart). | ||
| − | '''Tracer''': To view benchmark log and interaction of OOo's hotspots in roadmap and to export report in multi-format (like .ods, .html, ...) | + | '''Tracer''': To view benchmark log and interaction of OOo's hotspots in roadmap and to export report in multi-format (like .ods, .html, ...) |
| − | + | ||
== Web Supporting == | == Web Supporting == | ||
Show easy readable result on web. The benchmark tool can be used to fully test and verify our optimize work on OOo. | Show easy readable result on web. The benchmark tool can be used to fully test and verify our optimize work on OOo. | ||
| + | [[Image:Perf bm tool web.jpg]] | ||
| − | == | + | == How to Use Benchmark Tool == |
After we defined the performance diagram, we create numbers for every LOG tag to be inserted, then insert the tag and build the source, at last run the main test program and get the result on web. The PERFORMANCE_LOG is quite similar with RTL_LOG. | After we defined the performance diagram, we create numbers for every LOG tag to be inserted, then insert the tag and build the source, at last run the main test program and get the result on web. The PERFORMANCE_LOG is quite similar with RTL_LOG. | ||
== When you want to use, you can == | == When you want to use, you can == | ||
Besides the inserted PERFORMANCE_LOG, the test program is on our server. We plan to publish the server IP and support some user login. The server get the MWS source copy and build it after PERFORMANCE_LOG inserted. It dose not support automatic test now. So if you want test which CWS after you do some change on it, you can contact us by email. | Besides the inserted PERFORMANCE_LOG, the test program is on our server. We plan to publish the server IP and support some user login. The server get the MWS source copy and build it after PERFORMANCE_LOG inserted. It dose not support automatic test now. So if you want test which CWS after you do some change on it, you can contact us by email. | ||
| + | |||
| + | [[Category:Performance]] | ||
Latest revision as of 09:55, 25 February 2009
Contents
Purpose
Use benchmark tools to test and trace the performance of all OOo versions according to the predefined OOo product performance diagram. With the results, we can have the comparison between a main version and its CWS version, trace the different versions' performance and monitor variation of product continuously.
PERFORMANCE_LOG vs RTL_LOG
We created a new PERFORMANCE_LOG(PERFORMANCE_DIAGRAM & PERFORMANCE_BENCHMARK) macro to record the clock count or time when program was run. It uses numbers compare to string used by RTL_LOG, so it is more effective and much faster than RTL_LOG.
Another reason we not use RTL_LOG is that we don't hope the inserted PERFORMANCE_LOG changed after they are defined and inserted, because we want the test point are the same for different versions so that compare the test result is reasonable and valuable, and it is used only for performance benchmark test and we don't suggest to use it for other purpose.
Benchmark Tool Set
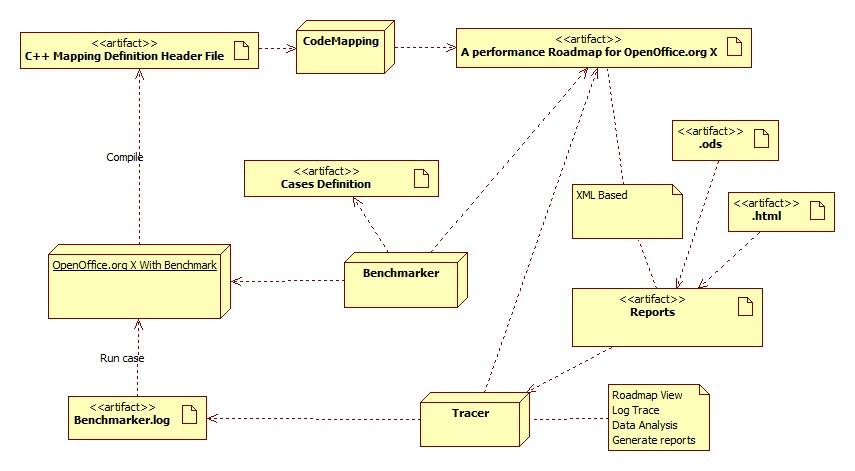
For getting readable report, a tool named Tracer will load a set of benchmarker log files, and fetch records of specified cases choosed with GUI application or web page. And export multi-format reports.
CodeMapping: To transform the performance roadmap into native language(C++/C) for getting numerical case-id and node-id definition header files. of performance test case in roadmap.
Benchmarker: To run standard cases defined in performance roadmap or user defined cases, and generate benchmark log(eg. Benchmarker.log in above chart).
Tracer: To view benchmark log and interaction of OOo's hotspots in roadmap and to export report in multi-format (like .ods, .html, ...)
Web Supporting
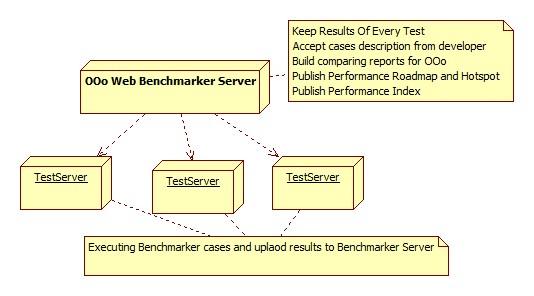
Show easy readable result on web. The benchmark tool can be used to fully test and verify our optimize work on OOo.

How to Use Benchmark Tool
After we defined the performance diagram, we create numbers for every LOG tag to be inserted, then insert the tag and build the source, at last run the main test program and get the result on web. The PERFORMANCE_LOG is quite similar with RTL_LOG.
When you want to use, you can
Besides the inserted PERFORMANCE_LOG, the test program is on our server. We plan to publish the server IP and support some user login. The server get the MWS source copy and build it after PERFORMANCE_LOG inserted. It dose not support automatic test now. So if you want test which CWS after you do some change on it, you can contact us by email.
