NL/Documentation/How Tos/Calc: functie GROEI
From Apache OpenOffice Wiki
GROEI
Maakt een exponentiële boog van een gegevensverzameling en geeft de punten op die boog weer.
Syntaxis:
GROEI(GegevensY; GegevensX; NieuweGegevensX; Functietype)
- gegevens is een bereik of matrix die numerieke gegevens bevat.
- GegevensY en GegevensX zijn bereiken van één enkele rij of kolom die punten specificeren binnen een bepaalde gegevensverzameling.
- GROEI maakt een exponentiële boog in de vorm y=bmx door deze gegevenspunten, met behulp van de lineaire regressiemethode.
- Als allow_factor is ONWAAR wordt de factor b in deze vergelijking imgesteld op 1; als allow_factor niet gelijk is aan nul, WAAR of weggelaten, wordt de factor b berekend vanuit de gegevens.
- GROWTH returns an array of the y values of the exponential curve found, corresponding to the x values in new_xvalues (or if omitted xvalues). It must be entered as an array formula (for example by using Cntrl-Shift-Enter rather than just Enter).
- yvalues and xvalues must be the same size. new_xvalues may have a different size.
Example:
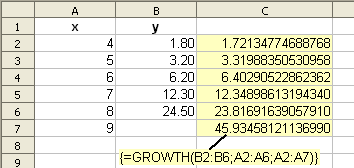
=GROWTH(B2:B6; A2:A6; A2:A7)
- when entered as an array formula in cell C2, where the x values in A2:A7 are 4, 5, 6, 7, 8, 9 and the y values in B2:B6 are 1.80, 3.20, 6.20, 12.30, 24.50, finds a best fit exponential curve for those points, and in C2:C7 returns y values on that curve for the x values in A2:A7.
- This example shows how GROWTH may be used to predict future values (A7,C7).
See also:
Functions listed alphabetically, Functions listed by category
