Difference between revisions of "Documentation/UserGuide/Draw/Tools/Bezier"
m |
|||
| Line 9: | Line 9: | ||
The curve on the figure was build with three points, the central displaying the slope controls. If we build the curve following the arrow, we can call the bar <big>a</big> as "former slope control" and the <big>b</big> bar as "later slope control". | The curve on the figure was build with three points, the central displaying the slope controls. If we build the curve following the arrow, we can call the bar <big>a</big> as "former slope control" and the <big>b</big> bar as "later slope control". | ||
| − | First of all, we need to select the Bézier tool [[File:ES-bezier2.png]] (the icon could be different depending on the icon set selected under {{Tools|Options|Apache OpenOffice|View|Icon size and style}}) and trace the curve following the steps below (each point on the list reflect the number on the picture below, the black arrow is the "real" curve while the red arrows show the movement of the mouse): | + | First of all, we need to select the Bézier tool [[File:ES-bezier2.png]] (the icon could be different depending on the icon set selected under {{Menu|Tools|Options|Apache OpenOffice|View|Icon size and style}}) and trace the curve following the steps below (each point on the list reflect the number on the picture below, the black arrow is the "real" curve while the red arrows show the movement of the mouse): |
# One click, without releasing the mouse button, on the starting point | # One click, without releasing the mouse button, on the starting point | ||
Revision as of 15:04, 16 February 2013
Template:Documentation/DraftPage
Bézier curves are common on vector drawing programs and are build giving a series of points, the slope to both sides of each point and how "flat" the curve it is there. The way on which Bézier curves are implemented on Draw is a bit different from other vector drawing programs like Inkscape, but it is not difficult to master.
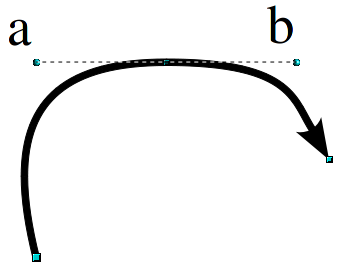
The curve on the figure was build with three points, the central displaying the slope controls. If we build the curve following the arrow, we can call the bar a as "former slope control" and the b bar as "later slope control".
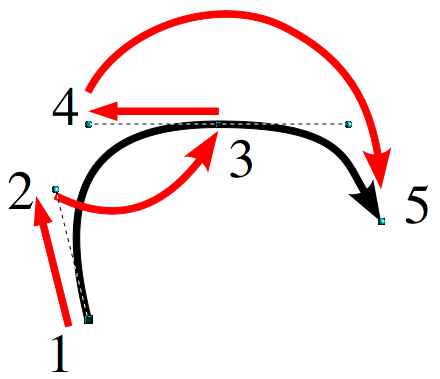
First of all, we need to select the Bézier tool ![]() (the icon could be different depending on the icon set selected under Tools → Options → Apache OpenOffice → View → Icon size and style) and trace the curve following the steps below (each point on the list reflect the number on the picture below, the black arrow is the "real" curve while the red arrows show the movement of the mouse):
(the icon could be different depending on the icon set selected under Tools → Options → Apache OpenOffice → View → Icon size and style) and trace the curve following the steps below (each point on the list reflect the number on the picture below, the black arrow is the "real" curve while the red arrows show the movement of the mouse):
- One click, without releasing the mouse button, on the starting point
- Move the mouse on the direction of the later slope control for that point and release the mouse button
- Click, again without releasing the mouse button, on the next point
- Move the mouse on the direction of the former control for that point and release the button
- Repeat points 3 and 4 until the curve is completed
- A double click on the last point or the initial will end the process (on the last case, the curve will be closed).
From the second point the "later control" is not specified. This point is automatically set on the opposite direction to the "former control".
Playing with the "Edit points" toolbar, it is possible to add, remove or move points, cut or "break" the curve, separating the controls behaviour to obtain angles.

