Difference between revisions of "Documentation/How Tos/Calc: TREND function"
From Apache OpenOffice Wiki
< Documentation | How Tos
(Initial content) |
|||
| (13 intermediate revisions by 5 users not shown) | |||
| Line 1: | Line 1: | ||
| − | + | {{Documentation/MasterTOC | |
| + | |bookid=1234''' | ||
| + | |booktitle=<div style="padding: 8px; font-size: 140%; font-weight: bold; background-color: #9BC0F5;">CALC FUNCTIONS</div> | ||
| + | |ShowParttitle=block | ||
| + | |parttitle=[[Documentation/How_Tos/Calc:_Array_functions|<div style="font-size: 140%;">Arrays Functions]] | ||
| + | |ShowNextPage=block | ||
| + | |NextPage= Documentation/How_Tos/Calc:_Complex_Number_functions | ||
| + | |ShowPrevPage=block | ||
| + | |PrevPage= Documentation/How_Tos/Calc:_TRANSPOSE_function | ||
| + | |ShowPrevPart=block | ||
| + | |PrevPart= Documentation/Reference/Calc_functions | ||
| + | |ShowNextPart=block | ||
| + | |NextPart= Documentation/How_Tos/Calc:_Complex_Number_functions | ||
| + | |toccontent= <div style="padding: 4px; font-size: 130%; font-weight: hidden; background-color:#DCE9FC;">FUNCTIONS</div> | ||
| + | |||
| + | * [[Documentation/How_Tos/Calc:_FREQUENCY_function|<div style="font-size: 120%;">Frequency]] | ||
| + | * [[Documentation/How_Tos/Calc:_GROWTH_function|<div style="font-size: 120%;">Growth]] | ||
| + | * [[Documentation/How_Tos/Calc:_LINEST_function|<div style="font-size: 120%;">Linest]] | ||
| + | * [[Documentation/How_Tos/Calc:_LOGEST_function|<div style="font-size: 120%;">Longest]] | ||
| + | * [[Documentation/How_Tos/Calc:_MDETERM_function|<div style="font-size: 120%;">Mdeterm]] | ||
| + | * [[Documentation/How_Tos/Calc:_MINVERSE_function|<div style="font-size: 120%;">Minverse]] | ||
| + | * [[Documentation/How_Tos/Calc:_MMULT_function|<div style="font-size: 120%;">Mmult]] | ||
| + | * [[Documentation/How_Tos/Calc:_MUNIT_function|<div style="font-size: 120%;">Munit]] | ||
| + | * [[Documentation/How_Tos/Calc:_SUMPRODUCT_function|<div style="font-size: 120%;">Sumproduct]] | ||
| + | * [[Documentation/How_Tos/Calc:_SUMX2MY2_function|<div style="font-size: 120%;">Sumx2my2]] | ||
| + | * [[Documentation/How_Tos/Calc:_SUMX2PY2_function|<div style="font-size: 120%;">Sumx2py2]] | ||
| + | * [[Documentation/How_Tos/Calc:_SUMXMY2_function|<div style="font-size: 120%;">Sumxmy2]] | ||
| + | * [[Documentation/How_Tos/Calc:_TRANSPOSE_function|<div style="font-size: 120%;">Transpose]] | ||
| + | * [[Documentation/How_Tos/Calc:_TREND_function|<div style="font-size: 120%; border-style: double; border-color:#778899;">Trend</div>]] | ||
| + | }} | ||
| + | __TOC__ | ||
== TREND == | == TREND == | ||
| Line 7: | Line 37: | ||
<tt>'''TREND(yvalues; xvalues; new_xvalues; type)'''</tt> | <tt>'''TREND(yvalues; xvalues; new_xvalues; type)'''</tt> | ||
: <tt>'''yvalues'''</tt> and <tt>'''xvalues'''</tt> are single row or column ranges specifying points in a set of data. | : <tt>'''yvalues'''</tt> and <tt>'''xvalues'''</tt> are single row or column ranges specifying points in a set of data. | ||
| − | : <tt>'''TREND'''</tt> fits a straight | + | : <tt>'''TREND'''</tt> fits a straight line through these data points, using the linear regression method. |
: If <tt>'''type'''</tt> is <tt>'''0'''</tt> the straight line found will pass through the origin; if <tt>'''type'''</tt> is non-zero or omitted the best fit straight line will be found. | : If <tt>'''type'''</tt> is <tt>'''0'''</tt> the straight line found will pass through the origin; if <tt>'''type'''</tt> is non-zero or omitted the best fit straight line will be found. | ||
| − | : <tt>'''TREND'''</tt> returns an array of the y values of the straight line found, corresponding to the x values in <tt>'''new_xvalues'''</tt> (or if omitted <tt>'''xvalues'''</tt>). It must be entered as an array formula (for example by using '''Cntrl-Shift-Enter''' rather than just '''Enter'''). | + | : <tt>'''TREND'''</tt> returns an array of the y values of the straight line found, corresponding to the x values in <tt>'''new_xvalues'''</tt> (or if omitted <tt>'''xvalues'''</tt>). It must be entered as an [[Documentation/How_Tos/Using Arrays|array formula]] (for example by using '''Cntrl-Shift-Enter''' rather than just '''Enter'''). |
: <tt>'''yvalues'''</tt> and <tt>'''xvalues'''</tt> must be the same size. <tt>'''new_xvalues'''</tt> may have a different size. | : <tt>'''yvalues'''</tt> and <tt>'''xvalues'''</tt> must be the same size. <tt>'''new_xvalues'''</tt> may have a different size. | ||
| Line 21: | Line 51: | ||
<br style="clear:both;" /> | <br style="clear:both;" /> | ||
| − | + | {{SeeAlso|EN| | |
| − | [[Documentation/How_Tos/Calc: INTERCEPT function| | + | * [[Documentation/How_Tos/Calc: INTERCEPT function|INTERCEPT]] |
| − | [[Documentation/How_Tos/Calc: SLOPE function| | + | * [[Documentation/How_Tos/Calc: SLOPE function|SLOPE]] |
| − | [[Documentation/How_Tos/Calc: | + | * [[Documentation/How_Tos/Calc: STEYX function|STEYX]] |
| − | + | * [[Documentation/How_Tos/Using Arrays|How To Use Arrays in Calc]] | |
| − | [[Documentation/How_Tos/Using Arrays| | + | * [[Documentation/How_Tos/Calc: Array functions|Array functions]] |
| − | + | * [[Documentation/How_Tos/Calc: Functions listed alphabetically|Functions listed alphabetically]] | |
| − | [[Documentation/How_Tos/Calc: Array functions| | + | * [[Documentation/How_Tos/Calc: Functions listed by category|Functions listed by category]]}} |
| + | [[Category: Documentation/Reference/Calc/Array functions]] | ||
| + | [[Category: Documentation/Reference/Calc/Statistical functions]] | ||
Revision as of 08:47, 17 July 2018
CALC FUNCTIONS
- Arrays Functions
- FrequencyGrowthLinestLongestMdetermMinverseMmultMunitSumproductSumx2my2
Contents
TREND
Fits a straight line to data using linear regression and returns points on that line.
Syntax:
TREND(yvalues; xvalues; new_xvalues; type)
- yvalues and xvalues are single row or column ranges specifying points in a set of data.
- TREND fits a straight line through these data points, using the linear regression method.
- If type is 0 the straight line found will pass through the origin; if type is non-zero or omitted the best fit straight line will be found.
- TREND returns an array of the y values of the straight line found, corresponding to the x values in new_xvalues (or if omitted xvalues). It must be entered as an array formula (for example by using Cntrl-Shift-Enter rather than just Enter).
- yvalues and xvalues must be the same size. new_xvalues may have a different size.
Example:
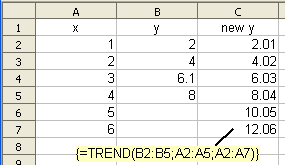
=TREND(B2:B5; A2:A5; A2:A7)
- when entered as an array formula in cell C2, where the x values in A2:A7 are 1,2,3,4,5, 6 and the y values in B2:B4 are 2, 4, 6.1, 8 returns {2.01|4.02|6.03|8.04|10.05|12.06}. The data points are very nearly on the line y = 2x (and would be if B4 contained 6 instead of 6.1). The best fit line found is therefore very nearly y=2x.
- This example shows how TREND may be used to predict future values.
See Also
-