Difference between revisions of "Documentation/DevGuide/Scripting/JavaScript Editor"
OOoWikiBot (Talk | contribs) m (Robot: Changing Category:Scripting) |
m |
||
| (3 intermediate revisions by 2 users not shown) | |||
| Line 6: | Line 6: | ||
|NextPage=Documentation/DevGuide/Scripting/Basic and Dialogs | |NextPage=Documentation/DevGuide/Scripting/Basic and Dialogs | ||
}} | }} | ||
| − | {{DISPLAYTITLE:JavaScript Editor}} | + | {{Documentation/DevGuideLanguages|Documentation/DevGuide/Scripting/{{SUBPAGENAME}}}} |
| + | {{DISPLAYTITLE:JavaScript Editor}} | ||
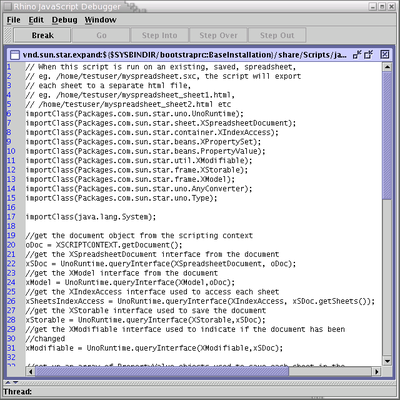
Clicking the Edit button in the JavaScript Organizer will open the Rhino JavaScript Debugger: | Clicking the Edit button in the JavaScript Organizer will open the Rhino JavaScript Debugger: | ||
| Line 13: | Line 14: | ||
The source of the JavaScript macro is displayed in the main window. The line numbers are shown in the left-hand sidebar. Clicking in the sidebar will set and remove breakpoints in the macro. There is currently a bug in the debugger which is not clearing the symbol in the sidebar when breakpoints are removed. | The source of the JavaScript macro is displayed in the main window. The line numbers are shown in the left-hand sidebar. Clicking in the sidebar will set and remove breakpoints in the macro. There is currently a bug in the debugger which is not clearing the symbol in the sidebar when breakpoints are removed. | ||
| − | The contents of the text window can be saved by selecting the '''File | + | The contents of the text window can be saved by selecting the '''File > Save''' menu item. The macro can be run by selecting the '''File > Run''' menu item. This activates the four buttons above the main text window: |
* Break | * Break | ||
| Line 29: | Line 30: | ||
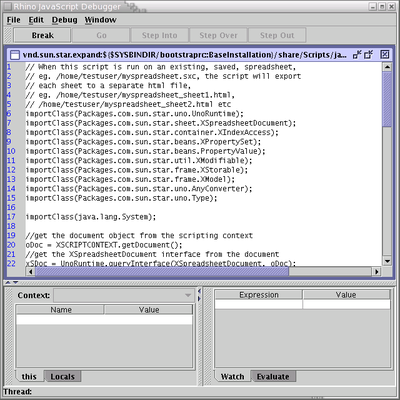
[[Image:JavaScriptEditorWithTabs.png|none|thumb|400px|JavaScript Debugger with Stack and Watch tabs displayed]] | [[Image:JavaScriptEditorWithTabs.png|none|thumb|400px|JavaScript Debugger with Stack and Watch tabs displayed]] | ||
| − | For more information on the Rhino JavaScript Debugger see [ | + | For more information on the Rhino JavaScript Debugger see [https://www.mozilla.org/rhino/debugger.html https://www.mozilla.org/rhino/debugger.html]. |
{{PDL1}} | {{PDL1}} | ||
| − | [[Category:Documentation/ | + | [[Category:Documentation/Developer's Guide/Scripting]] |
Latest revision as of 18:11, 21 December 2020
Clicking the Edit button in the JavaScript Organizer will open the Rhino JavaScript Debugger:
The source of the JavaScript macro is displayed in the main window. The line numbers are shown in the left-hand sidebar. Clicking in the sidebar will set and remove breakpoints in the macro. There is currently a bug in the debugger which is not clearing the symbol in the sidebar when breakpoints are removed.
The contents of the text window can be saved by selecting the File > Save menu item. The macro can be run by selecting the File > Run menu item. This activates the four buttons above the main text window:
- Break
- Sets a breakpoint at the line where the cursor is.
- Go
- Runs the macro, stopping at the next breakpoint (if one is set).
- Step Into
- Runs a single line of code, stepping into functions if they exist and then stop.
- Step Over
- Runs a single line of code, without stepping into functions and then stop.
- Step Out
- Continues the execution of the macro until it exits the current function.
There are two other panes in the debugger which are hidden by default. These allow the developer to view the stack and watch variables:
For more information on the Rhino JavaScript Debugger see https://www.mozilla.org/rhino/debugger.html.
| Content on this page is licensed under the Public Documentation License (PDL). |

