Difference between revisions of "Chart2/Range"
From Apache OpenOffice Wiki
< Chart2
Tonygalmiche (Talk | contribs) (→Allow access to a simple data series) |
B michaelsen (Talk | contribs) |
||
| (2 intermediate revisions by one other user not shown) | |||
| Line 3: | Line 3: | ||
== Draw and interpolate cells == | == Draw and interpolate cells == | ||
| + | [[Image:Chart2_Range01.png]] | ||
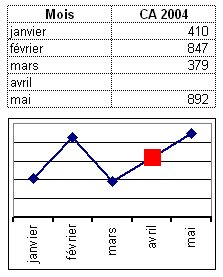
* Mark the interpolated points (missing points) with a different color. In this example, the data from April is missing but the point is created in the chart with a different color. | * Mark the interpolated points (missing points) with a different color. In this example, the data from April is missing but the point is created in the chart with a different color. | ||
* covered in http://www.openoffice.org/issues/show_bug.cgi?id=64819 | * covered in http://www.openoffice.org/issues/show_bug.cgi?id=64819 | ||
| Line 8: | Line 9: | ||
== Range names == | == Range names == | ||
| + | [[Image:Chart2_Range02.png]] | ||
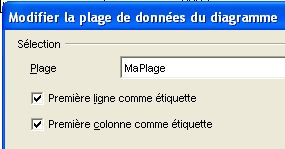
* If a name is indicated as a data range, this name is replaced in the corresponding range. | * If a name is indicated as a data range, this name is replaced in the corresponding range. | ||
* covered in http://www.openoffice.org/issues/show_bug.cgi?id=30288 | * covered in http://www.openoffice.org/issues/show_bug.cgi?id=30288 | ||
| Line 13: | Line 15: | ||
== Discontinued data ranges == | == Discontinued data ranges == | ||
| + | [[Image:Chart2_Range03.png]] | ||
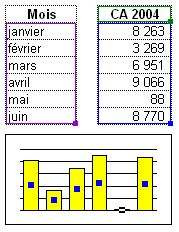
* The use of discontinued data range is not user friendly. One have to select the first range, add a « ; » then select the second range. Use of the Ctrl key to allow multiple selection could ease the use of this function. | * The use of discontinued data range is not user friendly. One have to select the first range, add a « ; » then select the second range. Use of the Ctrl key to allow multiple selection could ease the use of this function. | ||
* covered in http://www.openoffice.org/issues/show_bug.cgi?id=40679 | * covered in http://www.openoffice.org/issues/show_bug.cgi?id=40679 | ||
| Line 18: | Line 21: | ||
== Modify data range == | == Modify data range == | ||
| + | [[Image:Chart2_Range04.png]] | ||
* During data series selection, the range of corresponding cells is highlighted, but it's not possible to modify it. | * During data series selection, the range of corresponding cells is highlighted, but it's not possible to modify it. | ||
* covered in http://www.openoffice.org/issues/show_bug.cgi?id=12802 | * covered in http://www.openoffice.org/issues/show_bug.cgi?id=12802 | ||
| Line 23: | Line 27: | ||
== Manually modify the size of a bar chart == | == Manually modify the size of a bar chart == | ||
| + | [[Image:Chart2_Range05.png]] | ||
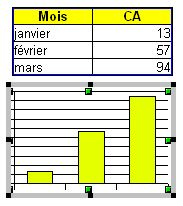
* In this example, the size is manually modified, the value decrease from 270 to 224 | * In this example, the size is manually modified, the value decrease from 270 to 224 | ||
* covered in http://www.openoffice.org/issues/show_bug.cgi?id=64820 | * covered in http://www.openoffice.org/issues/show_bug.cgi?id=64820 | ||
| Line 42: | Line 47: | ||
* Add the possibility to get the chart data from a separated file (linked document). It should be possible to disconnect the target from the data source and in this case, the chart will embed its own data. | * Add the possibility to get the chart data from a separated file (linked document). It should be possible to disconnect the target from the data source and in this case, the chart will embed its own data. | ||
* covered in http://www.openoffice.org/issues/show_bug.cgi?id=64823 | * covered in http://www.openoffice.org/issues/show_bug.cgi?id=64823 | ||
| − | + | [[Category:Chart2]] | |
| − | + | ||
| − | + | ||
| − | + | ||
| − | + | ||
| − | + | ||
Latest revision as of 09:23, 25 November 2009
This list is based primarily on the List of wished enhancements for Charts.
Contents
Draw and interpolate cells
- Mark the interpolated points (missing points) with a different color. In this example, the data from April is missing but the point is created in the chart with a different color.
- covered in http://www.openoffice.org/issues/show_bug.cgi?id=64819
Range names
- If a name is indicated as a data range, this name is replaced in the corresponding range.
- covered in http://www.openoffice.org/issues/show_bug.cgi?id=30288
Discontinued data ranges
- The use of discontinued data range is not user friendly. One have to select the first range, add a « ; » then select the second range. Use of the Ctrl key to allow multiple selection could ease the use of this function.
- covered in http://www.openoffice.org/issues/show_bug.cgi?id=40679
Modify data range
- During data series selection, the range of corresponding cells is highlighted, but it's not possible to modify it.
- covered in http://www.openoffice.org/issues/show_bug.cgi?id=12802
Manually modify the size of a bar chart
- In this example, the size is manually modified, the value decrease from 270 to 224
- covered in http://www.openoffice.org/issues/show_bug.cgi?id=64820
Each data source of a series could be a value list
- For each series, it should be possible to enter a value list (1, 3, 7...) instead of a reference to a data range (A1:A12).
- covered in http://www.openoffice.org/issues/show_bug.cgi?id=64821
Select one, several or all data series
- For example, it's not possible to modify the width of all the lines of the series at one time. It could be relevant to use the Ctrl key to do a multiple selection of series. Use of a stylist or a chart navigator could help here also.
- covered in http://www.openoffice.org/issues/show_bug.cgi?id=64822
Data source from an external source
- Add the possibility to get the chart data from a separated file (linked document). It should be possible to disconnect the target from the data source and in this case, the chart will embed its own data.
- covered in http://www.openoffice.org/issues/show_bug.cgi?id=64823


