Difference between revisions of "Chart2/Features3.0"
From Apache OpenOffice Wiki
< Chart2
Tonygalmiche (Talk | contribs) (→Ease editing regression lines (trendlines)) |
Tonygalmiche (Talk | contribs) (→Allow display of value and percentage value at the same time) |
||
| Line 37: | Line 37: | ||
* Specification : [http://specs.openoffice.org/chart/ChartDataLabels.odt ChartDataLabels.odt] | * Specification : [http://specs.openoffice.org/chart/ChartDataLabels.odt ChartDataLabels.odt] | ||
| − | [[Image:chart_data_label]] | + | [[Image:chart_data_label.png]] |
== Ease editing regression lines (trendlines) == | == Ease editing regression lines (trendlines) == | ||
Revision as of 08:38, 11 October 2008
Contents
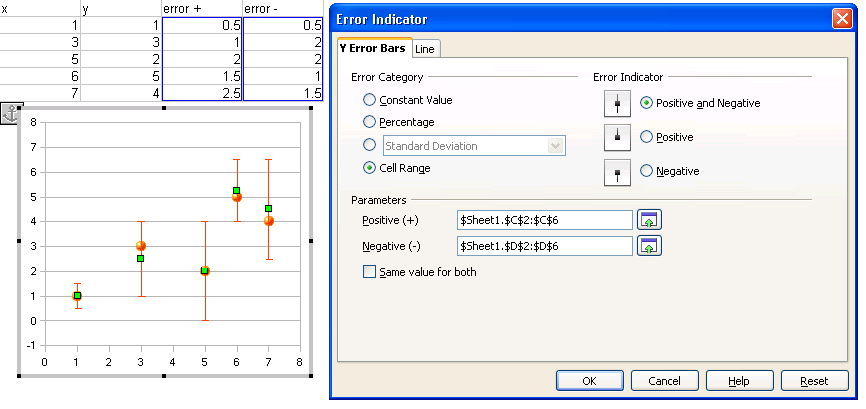
Select 'Range' for error bars
- Issue: 366
- Specification: ErrorBars.odt
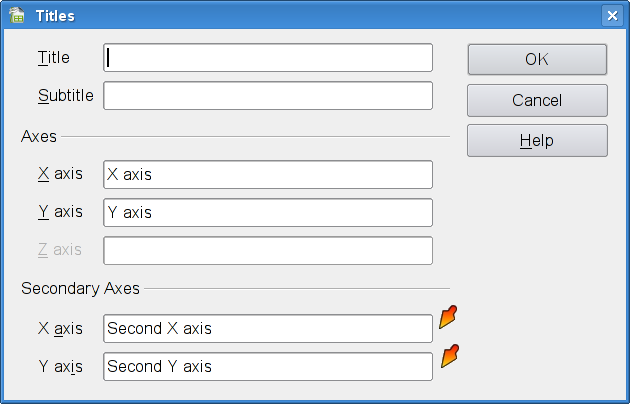
Title for secondary y axis
- Issue: 1163
- Specification : http://specs.openoffice.org/chart/ChartInsertTitleDialog.odt
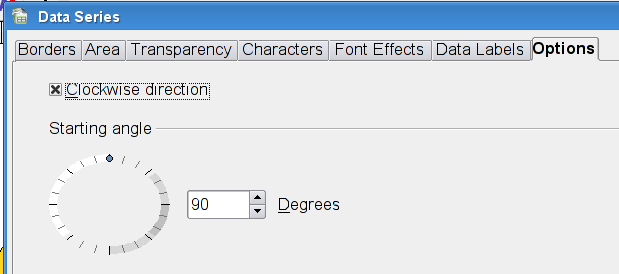
Clockwise pie chart
- Issue: 37823
- Specification : http://specs.openoffice.org/chart/PieChartOptions.odt
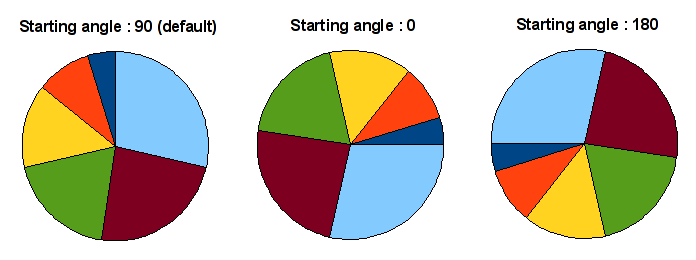
Starting angle for pie charts - rotation of pie charts
- Issue: 16776
- Specification : http://specs.openoffice.org/chart/PieChartOptions.odt
Allow display of value and percentage value at the same time
- Issue : 82295
- Specification : ChartDataLabels.odt
Ease editing regression lines (trendlines)
- Issue: 44768
- Specification : Trendlines.odt


