Difference between revisions of "Chart2/Features2.4"
From Apache OpenOffice Wiki
< Chart2
Tonygalmiche (Talk | contribs) (→Display equations for regression lines) |
Tonygalmiche (Talk | contribs) (→Enable reverse scales on axes) |
||
| Line 7: | Line 7: | ||
== Enable reverse scales on axes == | == Enable reverse scales on axes == | ||
| + | |||
| + | [[Image:Chart_OOo2.4_02.png]] | ||
| + | |||
* Issue : [http://distribution.openoffice.org/issues/show_bug.cgi?id=24614 24614] | * Issue : [http://distribution.openoffice.org/issues/show_bug.cgi?id=24614 24614] | ||
| − | * Specification : | + | * Specification : |
== Display bars on different axis next to each other == | == Display bars on different axis next to each other == | ||
Revision as of 11:58, 29 January 2008
Contents
- 1 Display equations for regression lines
- 2 Enable reverse scales on axes
- 3 Display bars on different axis next to each other
- 4 Number format for data labels
- 5 Display both value and percentage as data point label
- 6 Allow to display each part of a data label in a separate line
- 7 More flexible placement of labels on data points
- 8 Better automatic positions for lables on pie segments
- 9 Allow removing data point labels with delete key
- 10 Others Links
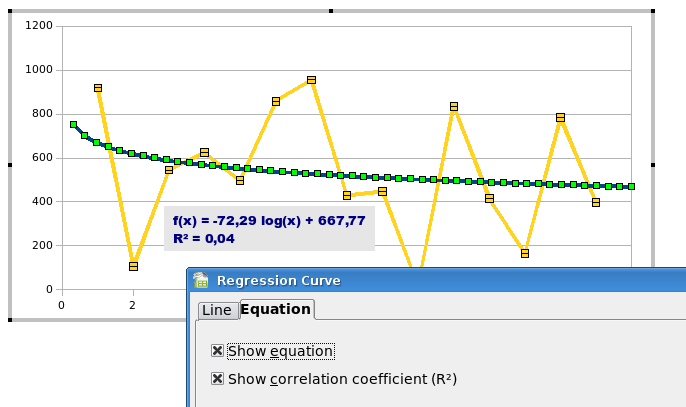
Display equations for regression lines
- Issue : 7998
- Specification :
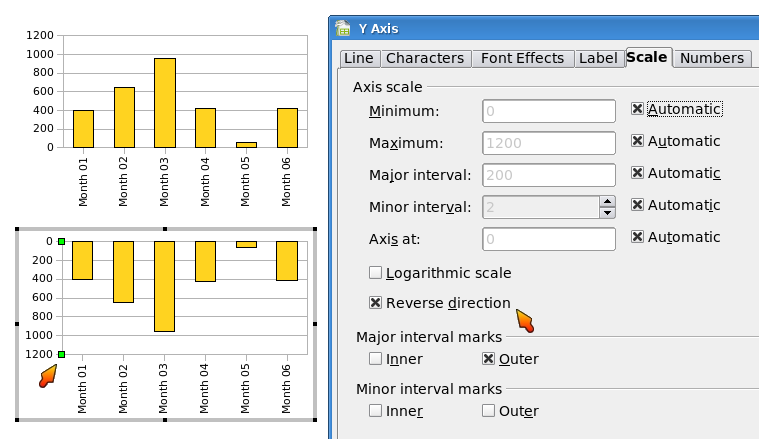
Enable reverse scales on axes
- Issue : 24614
- Specification :
Display bars on different axis next to each other
- Issue : 26795
- Specification : Bar Chart Options
- CWS : chart 14
Number format for data labels
- Issue : 37792
- Specification : http://specs.openoffice.org/chart/ChartDataLabels.odt
Display both value and percentage as data point label
- Issue : 43489
- Specification : http://specs.openoffice.org/chart/ChartDataLabels.odt
Allow to display each part of a data label in a separate line
- Issue : 82051
- Specification : http://specs.openoffice.org/chart/ChartDataLabels.odt
More flexible placement of labels on data points
- Issue : 63857
- Specification : http://specs.openoffice.org/chart/ChartDataLabels.odt
Better automatic positions for lables on pie segments
- Issue : 4039
- Specification : http://specs.openoffice.org/chart/ChartDataLabels.odt
Allow removing data point labels with delete key
- Issue : 83344

