Difference between revisions of "Chart2/ChartFormatting"
From Apache OpenOffice Wiki
< Chart2
Tonygalmiche (Talk | contribs) (→Ring chart) |
B michaelsen (Talk | contribs) |
||
| Line 72: | Line 72: | ||
* This vectorial graphics, in SVG format for example, could apply to some parts of the chart (background, bars, captions,...) | * This vectorial graphics, in SVG format for example, could apply to some parts of the chart (background, bars, captions,...) | ||
* covered in http://www.openoffice.org/issues/show_bug.cgi?id=64734 | * covered in http://www.openoffice.org/issues/show_bug.cgi?id=64734 | ||
| + | [[Category:Chart2]] | ||
Revision as of 09:21, 25 November 2009
Contents
- 1 Add a shadow
- 2 Modify the depth of a 3D chart that is too large by default
- 3 Properties of the symbol in data points
- 4 Modify a sector radius
- 5 Add drawing objects (text frames, arrows, ...)
- 6 Alternate colors in the grid
- 7 Format a single line segment
- 8 Modify characters attribute for a part of the text
- 9 Lock the modification or font size
- 10 Change the properties of all the parts of a Pie chart
- 11 3D rotation control
- 12 Apply a vectorial graphic to customize a chart
Add a shadow
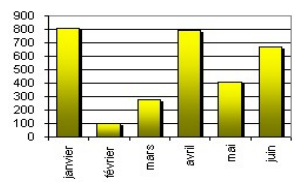
- Lot of formatting are available (color, gradient, Bitmap et hatching). It's even possible to play with transparency and shadows of the fonts.
- But it's not possible to add a shadow on the series.
- covered in http://www.openoffice.org/issues/show_bug.cgi?id=64706
Modify the depth of a 3D chart that is too large by default
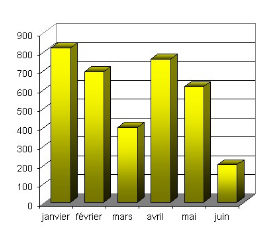
- It's possible to modify the depth of one series thanks to the 3D effect tool but I didn't find anything to modify the depth of overall the graphic.
Properties of the symbol in data points
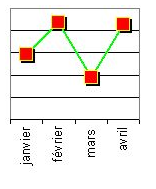
- Currently the filling color is the same as the data line and the contour line is thin and black. In this example, color of the line and of the symbol are customized and a shadow has been added.
- covered in http://www.openoffice.org/issues/show_bug.cgi?id=64728
Modify a sector radius
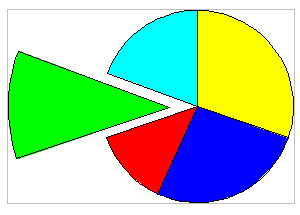
- Set different radius for chart parts of a sector chart in order to highlight them.
- covered in http://www.openoffice.org/issues/show_bug.cgi?id=64729
Add drawing objects (text frames, arrows, ...)
- However it's possible to add drawing objects above the chart.
- The best would be if we could link/group the drawing objects (eg: the arrow) with the parts of the chart. But I don't think it's currently possible with any other software.
- covered in http://www.openoffice.org/issues/show_bug.cgi?id=12587
Alternate colors in the grid
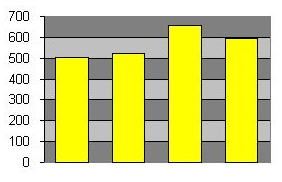
- Horizontal or vertical color bands to ease the reading of the lines like in a spreadsheet.
- covered in http://www.openoffice.org/issues/show_bug.cgi?id=64730
Format a single line segment
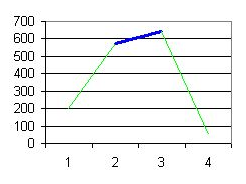
- Currently it's possible to format a bar in a diagram or a part of a sector part, but it's not possible in a line chart.
- covered in http://www.openoffice.org/issues/show_bug.cgi?id=64731
Modify characters attribute for a part of the text
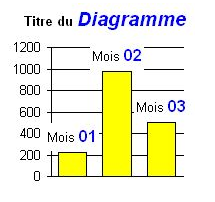
- In this example, part of the title is formatted differently, the same is for data labels.
- covered in http://www.openoffice.org/issues/show_bug.cgi?id=6521
Lock the modification or font size
- The character size of all the parts (title, legend, labels,..) is modify each time the size of the diagram is modified. It would be great to have an option that lock the modification of the character size.
- An option exist already, but it applies to all the parts in the same time and not individually to each part.
- covered in http://www.openoffice.org/issues/show_bug.cgi?id=36424
Change the properties of all the parts of a Pie chart
- For example change the width of a line for all the sectors at the same time
3D rotation control
- Add a button to set back the default rotation of 3D charts.
- covered in http://www.openoffice.org/issues/show_bug.cgi?id=64733
Apply a vectorial graphic to customize a chart
- This vectorial graphics, in SVG format for example, could apply to some parts of the chart (background, bars, captions,...)
- covered in http://www.openoffice.org/issues/show_bug.cgi?id=64734
