Difference between revisions of "Chart2/Axis"
From Apache OpenOffice Wiki
< Chart2
Tonygalmiche (Talk | contribs) |
Tonygalmiche (Talk | contribs) |
||
| Line 1: | Line 1: | ||
== Limit the number of axis labels displayed == | == Limit the number of axis labels displayed == | ||
| + | [[Image:Chart2_Axis1.png]] | ||
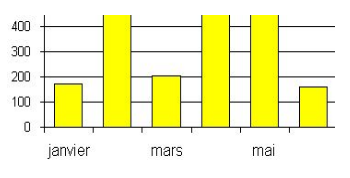
* 1 over 2, 1 over 3,... | * 1 over 2, 1 over 3,... | ||
* Displaying the labels is automatic but it doesn't always meet the needs. | * Displaying the labels is automatic but it doesn't always meet the needs. | ||
| + | * covered in http://www.openoffice.org/issues/show_bug.cgi?id=99999 | ||
| + | |||
== Inverse axis position == | == Inverse axis position == | ||
| + | [[Image:Chart2_Axis2.png]] | ||
* X axis at the top | * X axis at the top | ||
* Y axis at the right | * Y axis at the right | ||
| + | * covered in http://www.openoffice.org/issues/show_bug.cgi?id=99999 | ||
| + | |||
| + | |||
| + | == Reverse axis direction == | ||
| + | [[Image:Chart2_Axis3.png]] | ||
| + | * covered in http://www.openoffice.org/issues/show_bug.cgi?id=99999 | ||
| + | |||
| + | |||
| + | == Clockwise pie segment orientation == | ||
| + | [[Image:Chart2_Axis4.png]] | ||
| + | * covered in http://www.openoffice.org/issues/show_bug.cgi?id=99999 | ||
| + | |||
| + | |||
| + | == Affect units to the axis == | ||
| + | [[Image:Chart2_Axis5.png]] | ||
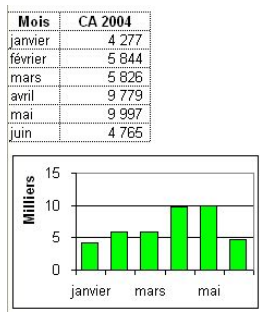
| + | * Hundreds, Thousands, Millions,... | ||
| + | * Kilo, Mega,... | ||
| + | * This example displays units in Thousands. | ||
| + | * covered in http://www.openoffice.org/issues/show_bug.cgi?id=99999 | ||
| + | |||
| + | |||
| + | == Add a title on the secondary Y axis == | ||
| + | [[Image:Chart2_Axis6.png]] | ||
| + | * A work around is to add a subtitle and to use it for the secondary axis, but it's a work around :-) | ||
| + | * covered in http://www.openoffice.org/issues/show_bug.cgi?id=99999 | ||
| + | |||
| + | |||
| + | == Modify the scale of X axis also when it's not an XY chart == | ||
| + | [[Image:Chart2_Axis6.png]] | ||
| + | * In this example, scale begins on the 1/1 and ends the 3/1 while data begin the 2/1 and end on the 4/1. | ||
| + | * covered in http://www.openoffice.org/issues/show_bug.cgi?id=99999 | ||
| + | |||
| + | |||
| + | == Axes labels customizable == | ||
| + | [[Image:Chart2_Axis7.png]] | ||
| + | * One can choose the label text format and number format regardless the data source range. | ||
| + | * In this example, date format displayed differently from the data range. March label text is manually modified. | ||
| + | * In Excel 2000, it's not possible to modify text and label format individually. | ||
| + | * covered in http://www.openoffice.org/issues/show_bug.cgi?id=99999 | ||
| + | |||
| + | |||
| + | == Enhance the automatic line break for axis labels == | ||
| + | * covered in http://www.openoffice.org/issues/show_bug.cgi?id=99999 | ||
| + | |||
| + | |||
| + | == Units of axes properties (numbers, hours, days, month == | ||
| + | * The dialog that allows to modify axes properties doesn't indicates units (hours, days, weeks, month...) to adjust the scale (minimum, maximum, primary and secondary intervals) | ||
| + | an axes formatted to date and where the primary interval settings are less than 24 hours will be displayed as “double” format and not as hours. | ||
| + | * It's not possible to set a maximum date or a minimum date but only a number representing date in a numerical format. | ||
| + | * If axes are in date format, it's not possible to settle an interval every 1st of each month. | ||
| + | * covered in http://www.openoffice.org/issues/show_bug.cgi?id=99999 | ||
| + | |||
| + | |||
| + | == Ability to fix the maximum and minimum property of axes from a spreadsheet cell == | ||
| + | * covered in http://www.openoffice.org/issues/show_bug.cgi?id=99999 | ||
| + | |||
| + | |||
| + | == Allow to change spacing between axes and axes labels == | ||
| + | * covered in http://www.openoffice.org/issues/show_bug.cgi?id=99999 | ||
| + | |||
| + | |||
| + | == Mini and maxi of a logarithmic scale == | ||
| + | * Manually settling of the maximum and minimum of a logarithmic scale is not available. | ||
| + | * covered in http://www.openoffice.org/issues/show_bug.cgi?id=99999 | ||
| + | |||
| + | |||
| + | == Interval of logarithmic scale == | ||
| + | * It's not possible to modify the primary interval in logarithmic scale | ||
| + | * A very detail spec is available, please see: | ||
| + | * http://specs.openoffice.org/chart/Chart_Scales_and_Intervals.odt | ||
| + | * covered in http://www.openoffice.org/issues/show_bug.cgi?id=99999 | ||
Revision as of 10:56, 15 July 2007
Contents
- 1 Limit the number of axis labels displayed
- 2 Inverse axis position
- 3 Reverse axis direction
- 4 Clockwise pie segment orientation
- 5 Affect units to the axis
- 6 Add a title on the secondary Y axis
- 7 Modify the scale of X axis also when it's not an XY chart
- 8 Axes labels customizable
- 9 Enhance the automatic line break for axis labels
- 10 Units of axes properties (numbers, hours, days, month
- 11 Ability to fix the maximum and minimum property of axes from a spreadsheet cell
- 12 Allow to change spacing between axes and axes labels
- 13 Mini and maxi of a logarithmic scale
- 14 Interval of logarithmic scale
Limit the number of axis labels displayed
- 1 over 2, 1 over 3,...
- Displaying the labels is automatic but it doesn't always meet the needs.
- covered in http://www.openoffice.org/issues/show_bug.cgi?id=99999
Inverse axis position
- X axis at the top
- Y axis at the right
- covered in http://www.openoffice.org/issues/show_bug.cgi?id=99999
Reverse axis direction
Clockwise pie segment orientation
Affect units to the axis
- Hundreds, Thousands, Millions,...
- Kilo, Mega,...
- This example displays units in Thousands.
- covered in http://www.openoffice.org/issues/show_bug.cgi?id=99999
Add a title on the secondary Y axis
- A work around is to add a subtitle and to use it for the secondary axis, but it's a work around :-)
- covered in http://www.openoffice.org/issues/show_bug.cgi?id=99999
Modify the scale of X axis also when it's not an XY chart
- In this example, scale begins on the 1/1 and ends the 3/1 while data begin the 2/1 and end on the 4/1.
- covered in http://www.openoffice.org/issues/show_bug.cgi?id=99999
Axes labels customizable
- One can choose the label text format and number format regardless the data source range.
- In this example, date format displayed differently from the data range. March label text is manually modified.
- In Excel 2000, it's not possible to modify text and label format individually.
- covered in http://www.openoffice.org/issues/show_bug.cgi?id=99999
Enhance the automatic line break for axis labels
Units of axes properties (numbers, hours, days, month
- The dialog that allows to modify axes properties doesn't indicates units (hours, days, weeks, month...) to adjust the scale (minimum, maximum, primary and secondary intervals)
an axes formatted to date and where the primary interval settings are less than 24 hours will be displayed as “double” format and not as hours.
- It's not possible to set a maximum date or a minimum date but only a number representing date in a numerical format.
- If axes are in date format, it's not possible to settle an interval every 1st of each month.
- covered in http://www.openoffice.org/issues/show_bug.cgi?id=99999
Ability to fix the maximum and minimum property of axes from a spreadsheet cell
Allow to change spacing between axes and axes labels
Mini and maxi of a logarithmic scale
- Manually settling of the maximum and minimum of a logarithmic scale is not available.
- covered in http://www.openoffice.org/issues/show_bug.cgi?id=99999
Interval of logarithmic scale
- It's not possible to modify the primary interval in logarithmic scale
- A very detail spec is available, please see:
- http://specs.openoffice.org/chart/Chart_Scales_and_Intervals.odt
- covered in http://www.openoffice.org/issues/show_bug.cgi?id=99999

