Calc/To-Dos/Statistical Data Analysis Tool
The purpose of this page is to outline the requirements of Calc's Statistical Data Analysis Tool (working name), which is yet to be developed by someone with willingness and skills. Feel free to contribute to this page what features you want to see in this tool, how such tool could be developed, or anything else that you need to add.
Contents
- 1 Goal
- 2 Statistical Models
- 3 Classical statistics
- 4 Survival Analysis
- 5 Overview single and multivariate data analysis
- 6 Desired Features
- 7 Task Breakdown
- 8 Resources
Goal
IMPORTANT As this page expands, it becomes imperative to organize/ reorganize the content. How should we structure this page?
- there is an obvius need for more structure in the statistical material
- but this should not preclude the development aspects
Should we split this page into more pages?
- one page covering the introduction and the statistics basics (up to and including Descriptive Statistics)
- one page devoted to graphics (in extenso)
- one page detailing the Statistical Inference ???
NB: You can click on the "edit" tab at the top of the page to edit the entire page, instead of section by section. Then you can copy & paste to reorganize sections as you see fit. --Kohei 05:26, 20 September 2006 (CEST)
Large amount of single or multivariate data require convenient functions to analyze them. There are countless statistical methods which accomplish this. Some of them are already integrated, but many of them are still missing. In most of the cases they produce one or more values out of one or many vectors of numbers (or categorical variables) which describe those vectors or their relationship between them. The aim is a collection of methods which are easy to use.
There are many other data analysis techniques beyond the classical statistical methods and most people (and software packages) overlook this. Indeed, in many non-biomedical fields, these techniques occupy a proeminent role and should be therefore addressed as well.
Non-Statistical Methods
There are many techniques to analyse the data. Below is just a glimpse of such methods. These will be discussed in greater detail on the following page: Non-Statistical Data Analysis Tool
- Data Mining: is primarily a non-statistical technique (see Wikipedia)
- Methods to summarize the information in a limited number of components, e.g. various linear dimension reduction techniques
- Energy-Frequency Analysis: Fourier Transform (limited to stationary and linear data), wavelet analysis, Wigner-Ville distribution and the more robust Empirical Mode Decomposition
- other signal processing techniques
Statistical Methods
The rest of this document will deal only with statistical methods. A separate wiki page discusses the Non-Statistical Data Analysis Tools (see previous paragraph and bottom of this page). The implementation of those tools should proceed generally through external software, when such free alternatives exist.
The statistical methods have evolved significantly over the last years. With the advent of cheap computer power, new computationally-intensive methods have become more popular and will ultimately replace the older and severely-plagued classical tests. Some of these advances include Bayesian statistics and various resampling procedures (bootstrap and jackknife procedures). I will try to introduce some of these newer methods because of the major intellectual advantages they offer.
The implementation of any of these newer techniques is unfortunately not as easy as for classical tests. Therefore, strong consideration should be given to implement such techniques through external programs when free alternatives exist.
Useful documentation/ material/ references on statistics can be found on the following page: http://cran.cnr.berkeley.edu/other-docs.html (especially in regard with R-use).
Statistical Models
- Classical Statistics
- Bayesian Statistics
Due to the complexity of Bayesian Statistics, the implementation should be done entirely through external programs (R and/or WinBUGS). [LOW PRIORITY, but the future belongs definitely to Bayesian statistics] In the rest of this document I will describe only classical statistical methods. There should be strong consideration to include parts of this file in the help file, too.
For the inherent problems in validating Bayesian Statistics Software see the R-Project Newsletter Vol 6/1, March 2006, "Bayesian Software Validation", p11-12, available freely at http://cran.r-project.org/doc/Rnews/Rnews-2006-1.pdf ;
Classical statistics
This document will be structured in a similar way to the reasoning for true statistical inference. I will deal in separate sections with the following topics:
- Descriptive statistics
- Statistical inference I: parametric tests (Gaussian-distribution)
- Statistical inference II: non-parametric tests
I will often give R-functions as examples. Some of the functions described are already available in Calc, some new could be implemented, but great consideration should be given to access them externally through R. A more detailed description of R will be given at the end of this file (section of external software integration).
Descriptive Statistics
Is dealt with on the following page: Calc/To-Dos/Descriptive_Statistics
Statistical inference: parametric tests (Gaussian)
These methods are already available in Calc. However, many should be superseded by modern methods. For a discussion of problems that arise when using the classical tests (why they fail in many real life situations) and an insight into new methods, see http://psychology.usc.edu/rwilcox/workshop.pdf and later on (Non-parametric tests).
One-Group and Two-Groups Inference
Two tests are widely available:
- z-test: group should be > 30 (or even bigger, depending on authorities)
- t-test: group might be small, but for very small groups, for many non-gaussian distributions, especially when the 2 distributions are different, the more robust non-parametric tests should be used (especially the permutation tests)
- proportions: Chi-square test
- every value from the contingency table should be at least 5-7
- the robust Fisher-Exact test should be used in most situations (see later)
Tutorial
IF the user insists on using a Gaussian test, he should be probably directed at using the t-test.
Multiple-Groups Inference
One-way ANOVA
For a good tutorial on one-way ANOVA see http://courses.ncssm.edu/math/Stat_Inst/PDFS/NEWANOVA.pdf Additional material on performing ANOVA analysis in R is available from the following web page: http://www.stat.lsa.umich.edu/~faraway/book/ (Practical Regression and Anova using R).
Statistical Inference: Non-Parametric Tests (distribution-free)
Unlike parametric models, these tests do NOT depend on any theoretical assumptions about distributions or any other specific population characteristic.
There are 3 main types of non-parametric tests:
- permutation tests: like Fisher (for proportions), Pitman-Welch (for dimensional data)
- resampling techniques: like bootstrapping (less often jack-knife)
- rank-tests: will probably be superseded by the previous two classes, too!
- Wilcoxon signed-rank Test
- Mann-Whitney-Wilcoxon U Test (Wilcoxon rank-sum Test)
- Kruskal-Wallis Test
Permutation Tests
Permutation tests exist for any test statistic, regardless of whether or not its distribution
is known. Thus one is always free to choose the statistic which best discriminates
between hypothesis and alternative and which minimizes losses. [Quote from Wikipedia]
- Fisher exact test: for proportions
- Pitman-Welch permutation test: for dimensional data
A good description about permutation tests can be found at http://bcs.whfreeman.com/ips5e/content/cat_080/pdf/moore14.pdf .
Fisher Exact Test
The Fisher exact test is the gold standard for the comparison of two proportions. The Chi-square test was favoured in the past because it was easier to calculate, however it is an inaccurate method, especially at small population sizes. As computing power is no longer a limitation, the Fisher test should be used instead.
R-syntax:
fisher.test(matrix(c('nr1', 'nr2', 'nr3', 'nr4'),2)),
# where 'nr1', ..., 'nr4' are the four values from the contingency table
# Return value: a list with class httest containing the following components:
#   p-value
#   odds ratio
#   confidence interval for the odds ratio
#   (additional text descriptions)
Pitman-Welch Permutation Test
This test is a permutation test similar to the Fisher exact test, but for dimensional data.
Rank Tests
Are useful for ordinal data and dimensional data that have non-Gaussian distributions. However, ultimately they will be replaced, too, by modern methods. Nevertheless, they are still the gold-standard for ordinal data!
Correspondence between Rank-Tests and Normal Tests
This table will show the correspondence between the various tests and the classical gaussian-tests for an easier understanding of the various rank-tests.
| Analysis Type | Normal Test | Rank Test |
|---|---|---|
| One Data Sample | One Sample t-Test | Wilkoxon Signed-Rank Test |
| Matched Pairs | One Sample t-Test for Differences Between Pairs | One Sample Test for Differences Between Pairs |
| Two Data Samples | 2-Sample t-Test | Wilcoxon Rank-Sum Test |
| Multiple Data Samples | One-Way ANOVA F-Test | Kruskal-Wallis Test |
TUTORIAL: Disimilar results between gaussian and rank-tests
Gaussian-test is not significant, while the rank test is significant?
- The result is statistically significant. Trust the rank test.
Gaussian-test is significant, while the rank test is not significant?
- In the rare situation you may come across this scenario. IF the data has a perfectly gaussian distribution, then the gaussian test is slightly more sensitive (i.e. more efficient, BUT NOT markedly so) and it could detect even a minimal statistical significance, while the rank test would not yet reach the statistical threshold.
- If the data does not have such a perfect distribution, you should have serious doubts about the results. I would recommend performing a resampling/ permutation analysis in such cases.
- See also http://userwww.sfsu.edu/~efc/classes/biol710/boots/boots.htm -> Section B: A distribution-free approach.
!!! PLEASE EXPAND
Wilkoxon Signed-Rank Test
Wilcoxon Rank-Sum Test
R-syntax:
wilcox.test('data-vector-1', 'data-vector-2')
Kruskal-Wallis Test
Special-Situations
Tied Values
Survival Analysis
Kaplan-Meier Curves
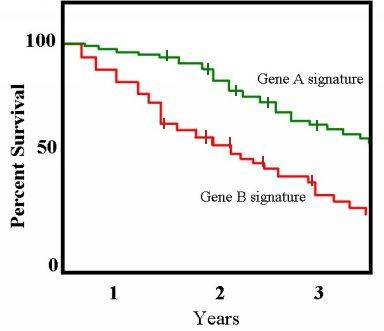
For details, see on Wikipedia.
R-syntax:
- package: survival
fit <- survfit(Surv(time, status) ~ x, data=aml)
plot(fit)
# fit is the survival object created by the function survfit()
# plot(fit) will plot the Kaplan-Meier curve
Cox-Proportional Hazards
Overview single and multivariate data analysis
just some thoughts ....
Graphics
A detailed description (very extensive) of graphical methods needed in Calc/ Chart is given on the Chart wiki page (http://wiki.services.openoffice.org/wiki/Chart2#Chart_Types). Unfortunately I am not able to syncronize both pages, therefore, please read that wiki page, too. I will concentrate here on R-implementation and R-syntax. See also the section on Descriptive Statistics.
- Basic types
- histogram
- Categorical data
- Bar charts (are implemented): important NOTE: if the user wants/selects a 3D bar chart, he should be cautioned that 3D bar charts are conceptually wrong, inaccurate and misleading and should be avoided in serious statistical analysis! (See Feinstein)
- Segmented bar graphs
- Pie charts (are implemented): some advanced features are still needed (see Chart wiki page)
- Venn/Euler diagrams: for overlapping categories, see paragraph on Graphical Presentations and also http://en.wikipedia.org/wiki/Venn_diagram for a detailed explanation
- Box Plots: important!!!
- Various Box and Whiskers Plots
- Other/ Complex Presentations (probably less critical)
- Violin
- Density
- Bubble/ Circle Plot: see Chart wiki page
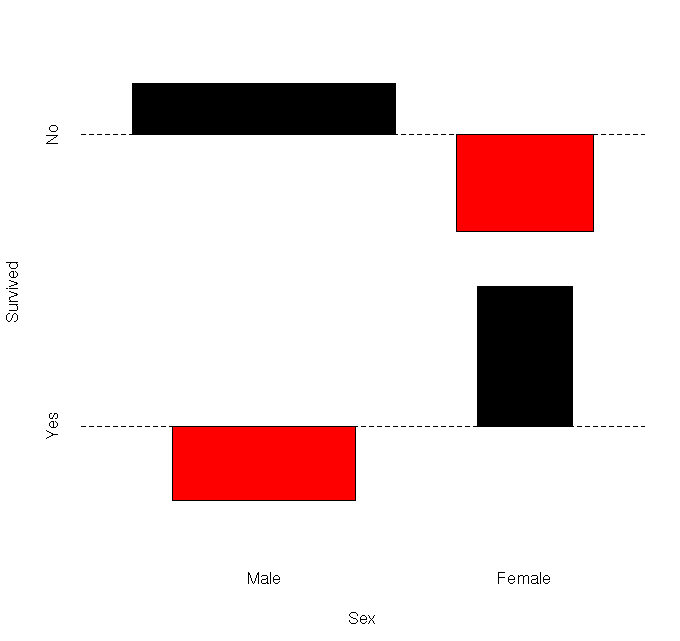
- Mosaicplot for crosstables (example: famous Titanic catastrophe ODS / Plot by R)
- related to mosaic: association - titanic example by R
- Bland-Altman Plot/ Tukey mean-difference plot: see http://en.wikipedia.org/wiki/Bland-Altman_plot
- Other: mainly non-statistical
- Gantt Charts
- Surface Charts
- Maps
Models
linear
non-linear
multivariate response variables
- multivariate tests
Test Characteristics
Rationale
In real life, a test result is not simply positive or negative, but rather produces a value, which is interpreted depending on a given cutoff. Depending on this cutoff, the various test characteristics may change.
It would be nice to automate the computations for these parameters:
- Sensitivity
- Specificity
- Receiver-Operating Characteristics Curves (ROC)
- Positive Predictive Value (PPV)
- Negative Predictive Value (NPV)
All these features are already available under R (see later in section Third Party Library Integration), packacke ROCR (visualizing classifier performance in R, ROCR-site)
Receiver-Operating Characteristics Curves (ROC-Curves)
The comparison between two tests is generally done calculating the area under the ROC curve.
Patterns
Cluster analysis
CCA
DCA
PCA
Desired Features
What features do users need as statistical data analysis tools?
- analysis of one-dimensional data
- Deviation from the median
- Variation Ratio
- Range
- Pearson r²
- analysis of multidimensional data
- graphical representation
Task Breakdown
User Input and Output
How this application needs to be structured...
Third Party Library Integration
R
R can be used as a backend statistical analysis engine. Since we can't ship R with OO.o due to licensing incompatibility (it's released under GPL), the location of its executable or shared library needs to be specified by the user so that OO.o can locate it at run-time.
- Question: Is it possible to integrate a bridge to R using the new extensions (those OXT plugins) in a package? I mean, a separate download, different licence note and so on? This package includes a reduced and tested version of R (R base packages, analysis stuff) together with some interface-stuff for OOo Calc. [platform: at first linux, later w32 ?].
- First step could be a set of R-scripts (fixed scripts with parameters are static functions, custom scripts should be possible, too, because many R features need more than one line of code) Those scripts are stored in one cell. On edit, you can select input argument locations from other cells(cell ranges) and the output is shown in those cell (or the cells below, if the return value is a list [R returns multiargument expressions in lists] - then it should be a Table: "Description - Value"). I'm not a developer and I cannot assume how complex this would be, but it could be a nice way to go. Perhaps a second step: integrating graphics - R is able to output graphics in PNG, then this temporary image is inserted into Calc. Is this possible, too?
- Integrating R under Windows: add-on package R(D)COM and the library rcom (see here and rcom package). There should be a possibility to embed R using the OXT plugin architecture.
- The add-on package R(D)COM and the library rcom make R accessible in the MS Windows client server COM and DCOM architecture. This technology allows to embed R into windows applications or use MS Windows applications as extensions to R. It can be used either in a way making R visible to the users or completely hiding it, using it as a statistical method library for other applications.
- For another R-Excel bridge, see http://linus.nci.nih.gov/BRB-ArrayTools.html .
- Integrating R under Unix: There are some GUIs developed specifically for R. One of this GUIs (rkward) can be downloaded from sourceforge.net and is written in C++. While it is limited to Linux/Unix, I believe that it would be possible to write/port a plugin for OOo, too, that would be able to interact with R.
- Integrating R: Platform-Independent
- There is an R-Java / Java-R bridge available (rJava and JRI, see http://www.rforge.net/rJava/ and for Java-to-R: http://www.rforge.net/JRI/ ). This should offer a way to develop a bridge between R and Calc that is largely platform-independent (as java is itself platform independent).
- See also Jaguar (a Graphical User Interface for R, http://www.rosuda.org/JGR/) which is also written in Java
- For other R-related software, see also http://www.rosuda.org/software/.
- Documentation:
- For a good article on R-integration issues, see this article.
AVANTAGES of R:
- offers complex statistical functions
- over 100 additional packages available
- e.g. Fisher exact-test, bootstrap procedures and other non-parametric tests
- linear regression models (including glm, generalized linear regression), as well as non-linear models
DISADVANTAGE
- R is a statistical environment (more like a programming language) and for beginners it is sometimes difficult to use
Calc should therefore ease the use by:
- providing easy access within Calc to
- basic R functions
Example of Fisher-test:
- syntax in R: fisher.test(matrix(c('nr1', 'nr2', 'nr3', 'nr4'),2)), where 'nr1-4' are the corresponding values to be tested.
- the user should be able to select the 4 cells in Calc and have a Menu-Item 'Fisher Test'; Calc should automatically pipeline the data (including correct syntax) into R
- a special note on this test: the Fisher exact test should be used in preference to the inaccurate Chi-Square test for contingency tables (I actually always use the Fisher test)
Example of Regression:
- linear regression:
- 'regression-object'<- lm(y ~ x1 + x2 + ...), where y, x1, x2, ... are vectors containing our data
- 'regression-object' is an object taking the results
- details can be obtained using the command: summary('our-object'), in this case summary('regression-object')
- lm() has of course numerous options not covered here
- generalized linear regression:
- 'object'<- glm(formula, other options...)
- non-linear models: e.g. nls(y ~ 1/(exp(a+k*x))), a sigmoid curve
Resources
See Also
Links
- Embedding R in Other Applications
- there are various extensions available that allows R-programs to be run in
- Windows: see paragraph on Integrating R under Windows, package rcom and R(D)COM component
- Unix: see paragraph on Integrating R under Unix, rkward on sourceforge.net
- Python: package RPy - is a very simple, yet robust, Python interface to the R Programming Language
- RObjectTables package might be a valueable concept in bridging the data to R and back
- allows one to use R objects and functions to define classes of objects that can be attached to the R search path and used to manage variables that are available to the R user
- allows external data from other applications, languages, storage formats to be treated as R variables without explicit conversion by the user
- Mediawiki (the software behind Wikipedia): the mediawiki R-Extension is probably less important for our objective, because it allows only a unidirectional communication (I was in contact with its author)
So it should be quite possible to run R iside Calc, too
Other Links