Difference between revisions of "Calc/Implementation/Chart2 Framework"
Clarence.guo (Talk | contribs) ((checkpoint save)) |
Clarence.guo (Talk | contribs) ((checkpoint save)) |
||
| Line 61: | Line 61: | ||
| template | | template | ||
| Templates to create each chart type based on the chart data table | | Templates to create each chart type based on the chart data table | ||
| + | |} | ||
| + | |||
| + | For each chart type, we must have below objects(use bubble chart as illustration): | ||
| + | * a template (BubbleChartTypeTemplate under source\model\template) to create chart type model based on the original data source | ||
| + | * a data source interpreter (BubbleDataInterpreter under source\model\template) to interpret the original data source and generate the chart type model according to the corresponding template | ||
| + | * a chart type model (BubbleChartType under source\model\template) | ||
| + | * a view object (BubbleChart under source\view\charttypes) | ||
| + | |||
| + | |||
| + | '''''2.3.2. View''''' | ||
| + | |||
| + | {| class="wikitable" | ||
| + | |- | ||
| + | ! Folder | ||
| + | ! Major Function | ||
| + | |- | ||
| + | | axes | ||
| + | | Coordinate system and axes | ||
| + | |- | ||
| + | | charttypes | ||
| + | | Shape creator for individual chart types | ||
| + | |- | ||
| + | | diagram | ||
| + | | View of diagram | ||
| + | |- | ||
| + | | main | ||
| + | | Kernel view objects: ChartView, VLegend, VTitle, VDataSeries... | ||
|} | |} | ||
Revision as of 02:53, 28 April 2012
1. Basic Concepts of Chart Kernel Objects
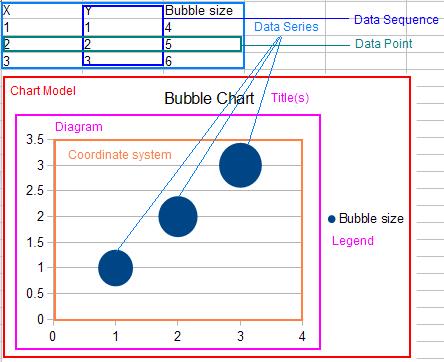
A chart model contains three major parts, titles(main title and sub-title), legend, and diagram which contains concrete chart data. The chart data is organized by chart type in a coordinate system. The chart type consist of data series, which represents as a series of individual data points with the same color. The data series is generally organized by column which is the default in the chart data table, but it can be organized by row as well. For some chart types, a data point needs several data units. For example, a bubble chart needs three data units: a X coordinate point, a Y coordinate point, and the bubble size. So it needs three columns(or rows according to the direction of the data series) to represent a completed data series. Each column or row is called data sequence. A diagram has a wall as the background of the coordinate system. For 3D charts, it also needs a floor. The hierarchical model of the chart kernel objects is like below chart.
- Chart Model
 Titles
   - Main title
   - Sub-title
 Legend
 Diagram
   - Chart wall
   - Chart floor
   - Coordinate system
     - Chart type
       - Data series
         - Data sequence
         - Data points
2. Characters of chart2 Module
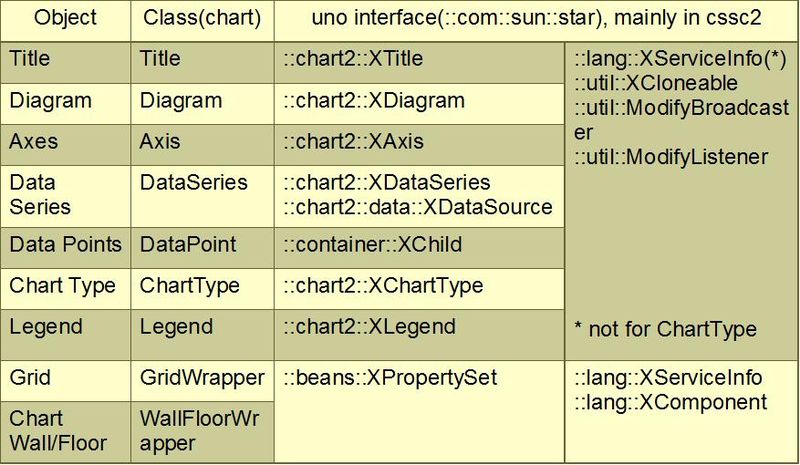
2.1. Well implemented uno interfaces Chart2 module well implemented uno interfaces. These interfaces are located in offapi\com\sun\star\chart which is the old interfaces and offapi\com\sun\star\chart2 which is the new. Each kernel chart objects must implement the corresponding interface defined in the offapi module. In order to keep the consistency with the old interface, some kernel objects implemented the new interface and also aggregated the old interface in the other hand. Below chart is an illustration of ChartModel, which implemented the new interface chart2::XChartDocument and aggregated the old interface chart::XChartDocument.

Below chart is another example to illustrate the interface implementations of some other kernel objects.
2.2. Typical MVC design pattern
The source code under chart2 module was categorized into five parts: model, view, controller, inc and tools, which is a typical MVC design pattern.
- model: kernel objects, binary file: chartmodelmi.dll
- view: drawing, binary file: chartviewmi.dll
- controller: events handler, interfaces for outside callers..., binary file: chartcontrollermi.dll
- tools: tools for chart handling, helper classes, binary file: charttoolsmi.dll
- inc: private include files
2.3. Breakdown of the MVC model
The section breakdowns the source code under chart2\source to interpret the major functions of each folder under model, view, controller.
2.3.1. Model
| Folder | Major Function |
|---|---|
| filter | Interface with xmloff |
| main | Kernel objects: ChartModel, Diagram, Title, Legend, DataSeries, DataPoint... |
| template | Templates to create each chart type based on the chart data table |
For each chart type, we must have below objects(use bubble chart as illustration):
- a template (BubbleChartTypeTemplate under source\model\template) to create chart type model based on the original data source
- a data source interpreter (BubbleDataInterpreter under source\model\template) to interpret the original data source and generate the chart type model according to the corresponding template
- a chart type model (BubbleChartType under source\model\template)
- a view object (BubbleChart under source\view\charttypes)
2.3.2. View
| Folder | Major Function |
|---|---|
| axes | Coordinate system and axes |
| charttypes | Shape creator for individual chart types |
| diagram | View of diagram |
| main | Kernel view objects: ChartView, VLegend, VTitle, VDataSeries... |