Chart2/TrendLines
From Apache OpenOffice Wiki
< Chart2
The printable version is no longer supported and may have rendering errors. Please update your browser bookmarks and please use the default browser print function instead.
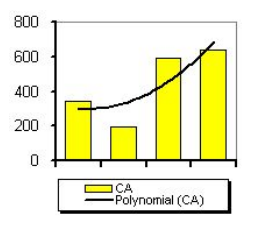
Add polynomial regression type
- Different types of regression lines are already offered: linear regression, exponential regression. But a polynomial regression curve is still missing. A macro on this site offers a workaround (french only):
- http://oooconv.free.fr/fitoo/fitoo_fr.html
- covered in http://www.openoffice.org/issues/show_bug.cgi?id=20819
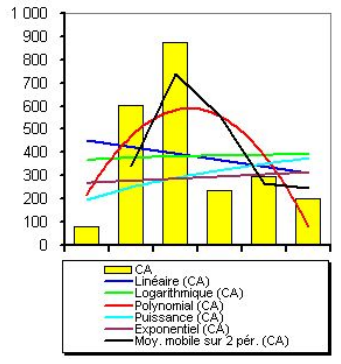
Allow more than one regression line for one series
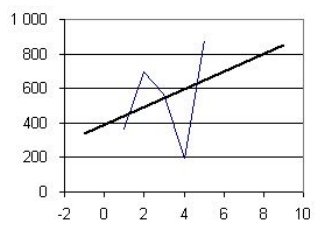
Extrapolating of trend lines
- Trend lines should also allow extrapolating. If data ranges from 1 to 5 but that x axes range from -2 to 10, then the trend line should display from -2 to +10.
- In Excel, the setting is called forward forecast and backward forecast.
- covered in http://www.openoffice.org/issues/show_bug.cgi?id=5085
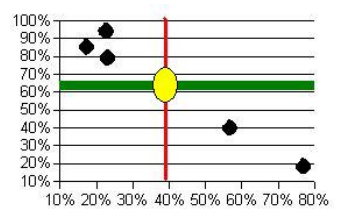
Mean value for X and center of gravity
- Get the mean value not only for Y but also for X. A special symbol could mark the intersection point (the center of gravity).
- covered in http://www.openoffice.org/issues/show_bug.cgi?id=64816
Error bar for X
- Error bar for X added to the existent Y one
- covered in http://www.openoffice.org/issues/show_bug.cgi?id=42946


